- January 16, 2023
Texas hedges
(noun – A hedged position that increases rather than reduces risk. thefreedictionary.com)
For many traditional defensive strategies, 2022 was a challenging year. For bonds in particular, the drawdowns highlighted the risks of relying on historic correlations for defensive properties. Just because it worked last time, doesn’t mean it will work the next.
With seemingly all market experts predicting a continuation of recent market turbulence into 2023, we look at what hedges might work this year and highlight the defensive benefits of a genuinely diversified portfolio hedging approach.
Traditional defensive scorecard… wide dispersions
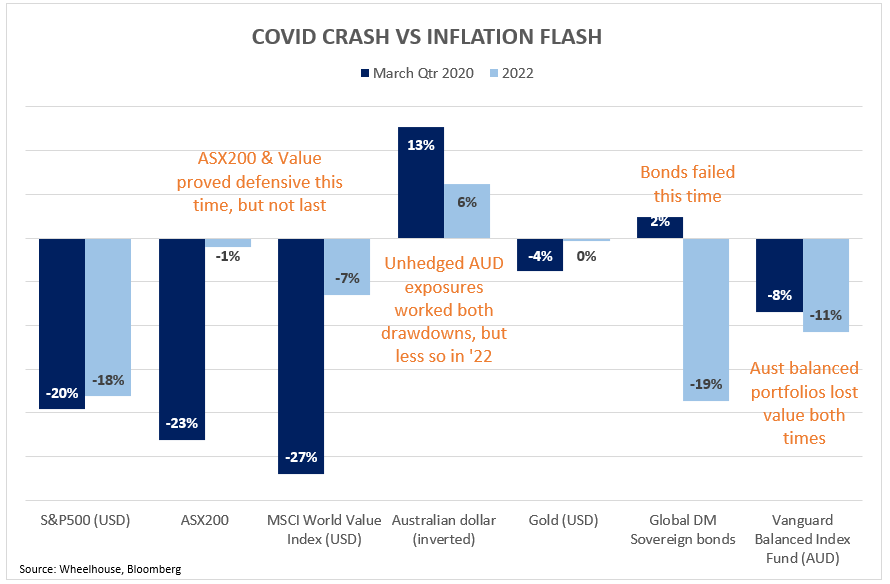
When comparing the different drawdowns of 2020 with 2022, it is worth highlighting just how unreliable and varied the different defensive exposures performed during these two periods. Staying close to home (S&P/ASX200), long Value and owning US Dollars all worked during 2022. Bonds? Not so much. Only the US Dollar proved reliably consistent, although it required a few months to kick in.
Of note for balanced investors who prize capital security, the two environments highlighted the fact that you only needed to be wrong-footed on one defensive exposure to be left facing material negative returns.
Why so unreliable?
Clearly the level of inflation and the subsequent change in interest rates posed a key difference between the two periods. The failure of bonds to protect a balanced portfolio should have come as no surprise, especially in an environment with high inflation – in the chart below we’ve reproduced from our May ’21 newsletter – the breakdown of the ‘typical’ negative correlation is quite apparent.
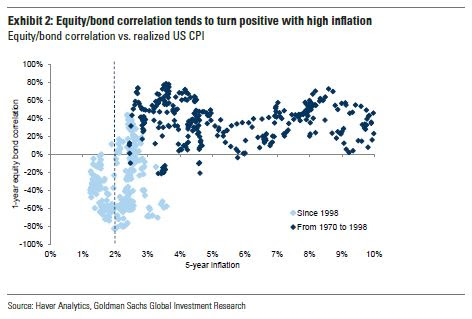
What did come as a surprise, however, was the magnitude of the rise of inflation and the ensuing hawkishness of the Federal Reserve as well as most other Central Banks to try and crush the spiralling prices.
The contrasting returns from the different periods make it apparent that those investors relying on the more traditional defensive exposures of Value or Bonds may need to have a view (and be right!) on the direction and magnitude of interest rate changes in order to deliver reliable protection for their portfolios.
Correlations don’t always hold
The problem with building defensive portfolios is that many defensive strategies rely on historical correlations to deliver the protective benefits. Paradigms change and as the two previous drawdowns have proven, these correlations can break down precisely when they are most needed.
Should the interest rate cycle change course in Q4 2023 as the market is pricing, then the favourable dynamics for many of the 2022 ‘winners’ may also reverse.
Many investors in gold are no doubt scratching their heads that despite an inflationary surprise, the yellow metal failed to live up to its inflation-hedging reputation. In the 1970’s gold increased by 20x (yes 20 times!), meaning that even a 5% exposure to the precious metal would have helped insure an entire portfolio. This time around though, it seems that the Federal Reserve was sufficiently hawkish enough to keep market inflation expectations under control avoiding the inflation spiral seen in the 1970’s. Hence market expectations also can play a key role here as well.
Avoiding Texas hedges (which move in the same direction as the exposure you are looking to hedge) can make huge differences in delivering reliable, repeatable defensive portfolios.
The role of alternatives
One advantage of alternative strategies is that they can provide a form of ‘mechanical’ protection, that is not reliant on historical correlations or interest rate environments.
Like well-considered insurance, well-constructed hedges are designed with specific objectives in mind. Different strategies will exhibit different defensive characteristics and can have very different payouts. The key is getting the mix right.
We highlight two systematic risk reducing approaches below, both of which we utilise across both of our funds.
- Option selling strategies, like a BuyWrite overlay, have delivered proven defensive benefits during more prolonged or ‘grind-down’ drawdown scenarios. Option selling generates consistent income, which is often elevated during a drawdown as volatility is higher.
- Option buying strategies, like buying tail protection, is more akin to buying an insurance policy on the market. As with insurance there are techniques available that target specific risks and thus reduce costs.
For further analysis on these approaches during the two recent drawdowns please refer to our thought piece from June “Two very different bears”.
Well diversified hedges can take the guesswork out of delivering consistent and reliable protection. As we look forward to 2023 and the uncertainty that lies ahead, we believe a diversified hedging approach will continue to deliver value when it is most needed, without having to predict the tipping point of the interest rate cycle and the correlations that may (or may not) result.
Wheelhouse Global Equity Income Fund
8.0%
Income over 5 years (p.a.)
6.9%
Total return 5 years (p.a.)
| 1 month | 1 year | 3 years p.a | 5 years (p.a.) | Since inception^ | |
| Income | 1.9% | 7.5% | 7.8% | 8.0% | 7.6% |
| Growth | (3.5%) | (9.3%) | (3.6%) | (1.1%) | (1.2%) |
| Total Return | (1.7%) | (1.8%) | 4.2% | 6.9% | 6.4% |
| RBA +2.5% | 0.4% | 3.8% | 3.1% | 3.4% | 3.5% |
| Benchmark* | (5.5%) | (12.5%) | 6.2% | 9.3% | 9.3% |
| Market Risk** | nm | 0.5 | 0.4 | 0.5 | 0.6 |
Performance figures are net of fees and expenses.
* Benchmark is the MSCI World Index (ex-Australia).
** Risk is defined as Beta and sourced from Morningstar Direct. Beta is represented vs the Benchmark and vs the S&P/ASX 200 Index. A Beta of 1.00 represents equivalent market risk to the comparison Index. A minimum of 12 months data is required for the calculation.
^ Inception date is 26/05/2017. Since inception figures are calculated on a p.a. basis. Past performance is not an indicator of future performance.
Click here to read the full performance report of the Wheelhouse Global Equity Income Fund.
Wheelhouse Australian Enhanced Income Fund
11.3%
Income since inception p.a.
6.4%
Total return since inception p.a.
| 1 month | 3 months | 6 months | 1 year | Since inception^ | |
| Income* | 1.1% | 1.6% | 5.6% | 12.0% | 11.3% |
| Growth | (3.8%) | 6.8% | 4.9% | (15.8%) | (4.9%) |
| Total Return | (2.7%) | 8.4% | 10.5% | (3.8%) | 6.4% |
| Benchmark** | (3.2%) | 9.6% | 10.8% | 0.5% | 7.7% |
| Excess return | 0.5% | (1.2%) | (0.3%) | (4.3%) | (1.3%) |
Performance figures are net of fees and expenses.
* Income includes cash distributions and the value of franking credits and special dividends. Cash distributions are paid quarterly.
** Benchmark is the S&P/ASX 200 Franking Credit Adjusted Daily Total Return Index (Tax-Exempt).
^ Inception date is 9/03/2021. Since inception figures are calculated on a p.a. basis. Past performance is not an indicator of future performance.
Click here to read the full performance report of the Wheelhouse Australian Enhanced Income Fund.