It goes without saying that protective strategies need to work in bear markets – but a review of three traditionally defensive strategies during the past two major drawdowns shows very mixed results. Depending upon the market conditions, some strategies worked and some failed.
In the charts below we use style indexes to illustrate the different returns during these two drawdown events with returns of the S&P500 Index. The strategies represented are:
- Tail hedging – represented by the S&P500 5% Put Protection Index (PPUT). This Index pairs ownership of the S&P500 with a monthly protective put option with a strike 5% out-of-the-money.
- BuyWrite overlay – represented by the S&P500 BuyWrite Index (BXM). This Index pairs ownership of the S&P500 with the sale of a monthly call option with a strike at-the-money.
- Value style – represented by the S&P500 Value Index
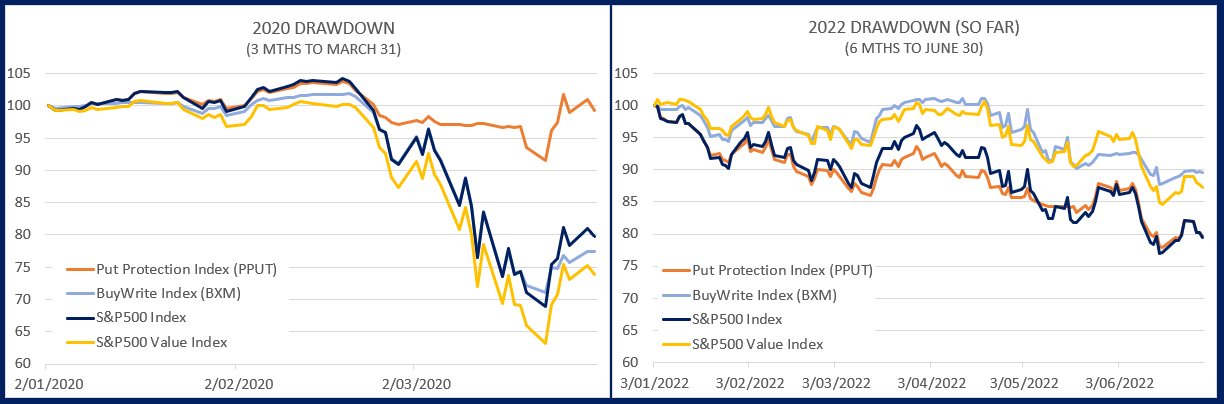
2020 Drawdown
During the aggressive Coronavirus selldown where the market fell over 35% from its high in just a few weeks, protective tail hedging strategies were worth their weight in gold. The bought put options with strikes only 5% below the market were very quickly demonstrating their protective properties during a crisis, nearly fully insulating the portfolio during the worst of the downturn.
By comparison, Overlay and Value strategies underperformed, offering little to no protection at all.
Overlays are not well suited to providing protection during aggressive sell offs, as the income generation offers only a limited defensive buffer in a short, sharp sell off. Furthermore, Value also underperformed as the rotation of demand into more stay-at-home type activities, plus aggressive monetary and fiscal easing, both served to benefit Growth/technology exposures over Value.
2022 Drawdown (to date)
How things changed! So far in the current drawdown, Overlay and Value strategies have roughly halved the market losses, bearing in mind that losses are far shallower than in 2020. During this drawdown the combination of a far more gradual sell-off which allowed more time for income generation helped to meaningfully buffer losses. Combined with a tightening Fed policy to combat inflation, Value strategies also delivered a good result in terms of capital preservation.
By comparison in this more recent drawdown, tail hedging strategies effectively delivered zero value (even with only a 5% out-of-the-money strike), as the market falls were just too shallow and took far longer to materialise (combined with elevated volatility which made hedging more expensive).
Is there a lesson for what is the best approach?
What seems clear is that there is no one single defensive investment strategy that works in every market environment. We might add to this list the exposure to the Australian dollar, which is ‘usually’ defensive and falls during a market crash, but as we saw during February this year, is not always a reliable defensive partner (and can make things worse).
We could sit in cash of course and enjoy a guaranteed defensive exposure, however the low returns would also guarantee (for most of us) that we would fail to achieve our investment goals.
Thus in order to target equity returns but with much better drawdown characteristics, it makes sense to diversify across defensive strategies that are better suited to a range of market environments.
An example of defensive diversification
In the Wheelhouse Global Fund we rely on tail hedging for more acute market falls, plus a systematic BuyWrite overlay for more ‘grind down’ scenarios that take longer to manifest. We acknowledge we don’t know what the next drawdown will look like, or how long it will take, so we rely on diversification of defensive approaches to deliver a highly reliable defensive profile that is designed to nearly halve losses across any type of drawdown.
When paired with a fully invested and generally balanced (Growth/Value) equity portfolio, the end result is expected to be highly reliable – with no surprises when you can least afford them.
The charts below plot the defensive characteristics across the same time periods as above.
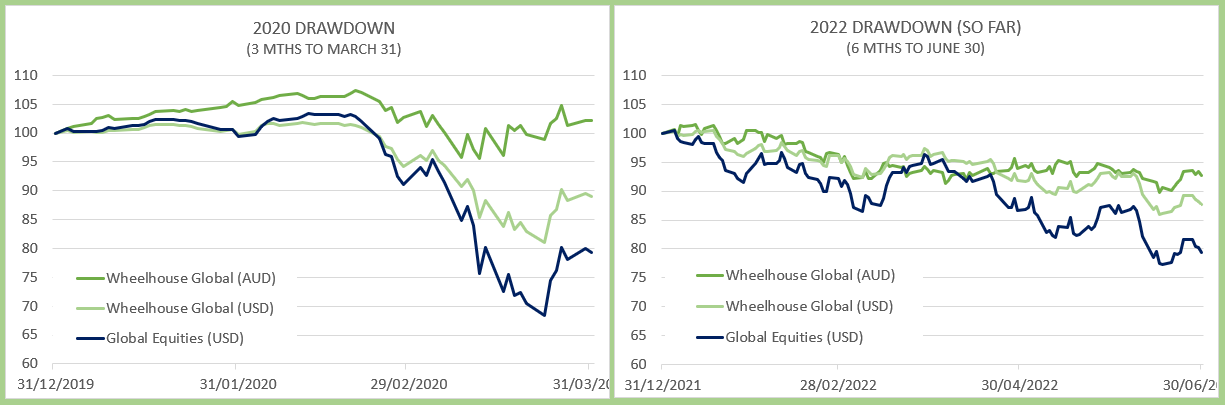
The Global fund was slightly positive during the 2020 drawdown and is 7% down during the current bear market. On a USD basis which removes the impact of currency, the fund caught 53% of the drawdown in 2020 and 57% of the drawdown in 2022, both of which are consistent with our risk management targeting.
However the main source of protection across both drawdowns was very different. Similar to the Style Index returns above, most of the defensive benefits were delivered by the tail hedge in 2020 and then by the Overlay in 2022. Through active risk management of Overlay and Tail hedge, the drawdown outcome remained highly reliable regardless of the market environment.
As the portfolio is unhedged from a currency perspective, it also usually benefits during drawdowns as the AUD usually declines. As we discussed in our February newsletter (‘Australian Dollar: Friend or foe’), this defensive characteristic is less reliable than the risks we can otherwise control via Tail hedging and Overlay strategies. We are investigating ways of managing this exposure better internally, and importantly seeking to reduce the currency drag when markets recover.
One large bet we don’t make is Value vs Growth, as we believe this one can be a little unpredictable (and tends to mean revert over time anyway). Through incorporating defensive strategies like tail hedging that are designed for sudden acute drops, or overlays that are better suited for much slower market grind down environments, we remove the need to try and second guess which types of stocks or sectors are likely to prove defensive.
So where to from here?
There are a number of benefits that result from minimising drawdowns that we won’t go through here. However, minimising drawdowns is only half the story, as we also need to maximise our participation as and when markets recover. Remaining fully invested and not trying to time market rebounds ensures that what happens from this point is treated as equally important to the performance in getting here.
This communication is for Wholesale investors only and has been prepared by Wheelhouse Investment Partners Pty Ltd (ABN 26 618 156 200), a Corporate Authorised Representative (CAR 001253586) of Perpetual Corporate Trust Limited (ABN 99 000 341 533) AFSL 392673. It is general information only and is not intended to provide you with financial advice or take into account your objectives, financial situation or needs.
Past returns are not an indicator of future returns. You should consider, with a financial adviser, whether the information is suitable for your circumstances. To the extent permitted by law, no liability is accepted for any loss or damage as a result of any reliance on this information.
The product disclosure statement (PDS) for the Wheelhouse Global Equity Income Fund, issued by The Trust Company (RE Services) Limited, should be considered before deciding whether to acquire or hold units in the fund. The PDS and TMD can be obtained by calling +61 7 3041 4224 or visiting www.wheelhouse-partners.com. No company in the Perpetual Group (Perpetual Limited ABN 86 000 431 827 and its subsidiaries) guarantees the performance of any fund or the return of an investor’s capital.