- March 11, 2022
Australian Dollar: Friend or foe?
For Australian-based investors in unhedged Global share portfolios, the Australian dollar is usually our friend during a crisis.
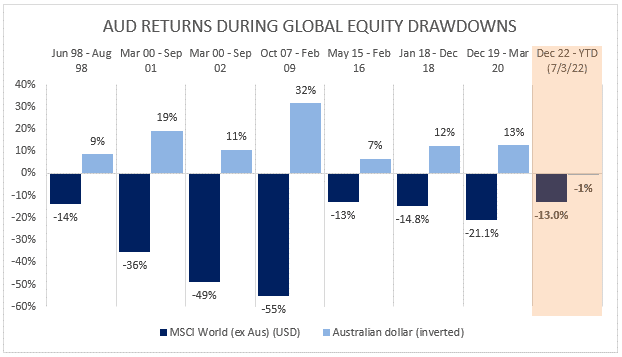
Over the past 30 years, corrections (greater than 10% declines) in Global markets have consistently coincided with declines in the Australian dollar which in turn has protected Australian investors to some extent during times of crisis.
However, during the most recent crisis, the Australian dollar has proven a little ‘unfriendly’ for Australian investors in Global shares. Year to date (and particularly in February), the Australian dollar strengthened despite the worsening geopolitical and stock market developments. This strengthening adds to losses in Australian dollars on a Global share portfolio.
Why has the AUD proven defensive for Global equity portfolios in the past?
Historically the Australian dollar has been perceived as a ‘risk’ currency, in part due to our high exposure to commodity exports to China and sensitivity to global growth. When the outlook is rosy, the AUD typically rallies (risk-on) and when clouds appear, the AUD typically falls (risk-off). During a crisis there is usually a ‘flight to safety’ whereby investors buy USD and sell AUD, as they seek protection in the world’s number one reserve currency.
In fact, the relationship is so strong that the AUD is often used as an alternative hedge to protect equity portfolios from share market declines. This is partly evidenced when looking at global foreign exchange volumes. The AUD/USD cross accounts for 6% of global foreign currency transactions which seems disproportionate when compared to the Australian economy and share market which are less than 2% of Global totals. Many hedge funds and institutions have reported using the AUD as both a hedge and speculatively when volatility is attractive relative to buying protective equity puts outright.
How reliable is the AUD as a hedge?
As the chart above illustrates, over more acute drawdowns the Australian dollar has historically proven highly reliable in terms of offering protection during market corrections. However over shorter periods, (such as month by month) the protection is not always as reliably evident.
The left-hand chart below plots monthly movements of the S&P500 Index vs the move in the AUD/USD exchange rate, for all monthly market declines of -3% or greater (since 1990). For monthly movements the AUD is usually defensive, but not always. From a frequency perspective, 75% of data points are above zero (AUD our ‘friend’), with the magnitude of these beats far greater than losses.
To compare this with an example of active risk targeting, the chart on the right-hand side highlights capital preservation of the Wheelhouse Global fund during negative returning days, since inception. The datapoints represent every negative returning day for Global equities greater than -1% since May 2017.
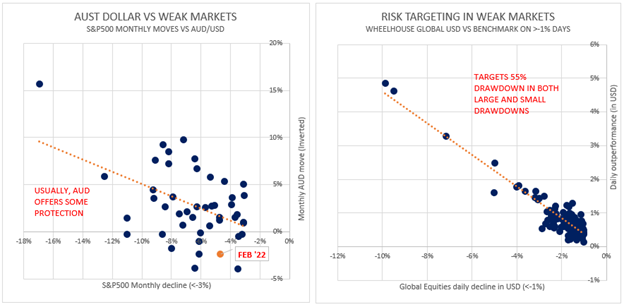
Clearly, while the AUD has generally provided monthly protection, when compared to active risk targeting in the chart at the right, the difference in efficacy is dramatic. Within the Global fund we use a combination of income producing overlay, integrated with ‘always-on’ tail hedging, to produce a largely mechanical and hence highly reliable downside risk profile, despite the fund being near fully invested at all times.
The hidden difference between the two profiles is cost. We expect our tail hedging programme to cost around 1.5% a year in returns, on average. When we compare this with the equity returns we expect to mostly capture, we are willing to accept this insurance-like cost.
However, the exposure to an unhedged Australian dollar is expected to be zero cost, over time. The reason for this is major currencies are generally mean reverting, meaning they will trade up, and down, but likely to cross fair value many times in the years ahead. In this sense, the AUD offers an element of free protection during a drawdown, which is then paid for in better times when markets recover and the AUD appreciates again.
Why is it different this time?
The surprising near-term strength in the AUD given the risk off environment, perhaps isn’t so surprising when the current conditions are considered:
- The bull run in commodities driven both by supply side issues from Russia, and inflation protection demand from everywhere else. For example, Russia provides Europe with 67% of its metallurgical coal (steel making), along with providing Germany half of its thermal coal (power generation)*. Hence Europe’s move to sever economic ties with Russia is helping push coal prices higher, one of our key exports.
- Potentially a soon to be pivoting RBA from dovish to hawkish is also likely to provide some tailwind for the AUD.
- The conflict in Europe can make faraway Australia feel a whole lot safer than the rest of the world.
In fact, ‘safe-haven’ has started being used loosely in the same sentence as the Australian dollar, which is a new thing. If this proved true, then looking forward it would likely upend all the historic defensive characteristics that have been evident over the past 30 years. We think this is extremely unlikely.
While we understand the recent bid for AUD, if anything the events of recent weeks underscore why we believe the AUD is the oppositive of a safe haven currency. All of the key ingredients of the current crisis in Europe are, in our opinion, right at our doorstep in Asia.
- Economic sanctions are increasingly being weaponized by nations seeking to avoid outright conflict. It seems highly likely that should the geopolitical environment deteriorate in our own region, aggressive/retaliatory sanctions are likely to escalate.
- While iron ore is the dominant export and it remains questionable whether China could locate alternate supply (we’ll leave that to resource analysts), what can get missed is that our economy is also far more heavily reliant on Chinese imports to key industries than any of our security partners in the Five Eyes (UK, US, Canada, NZ).
- Taken together, while Russia supplies roughly 30% of energy needs to Europe, China accounts for over 30% of our total trade. Hence the economic impact on our economy (and balance of payments) would likely to be far more acutely felt and damaging.
The risk of conflict in Asia is what we would call a known unknown, in Rumsfeld speak. The risk is in plain sight, however the likelihood or timing of it materialising is impossible to know. Like most tail events however, we believe the risk (and potential damage) is likely vastly underestimated by most investors, particularly those with extensive Australian equity portfolios.
While the Australian dollar may be proving an unreliable friend more recently, should a genuine black swan scenario materialise we believe the Australian dollar would quickly revert to historical norms and prove incredibly valuable, just when our domestic investments may be faring their worst. Like skew on a put option after Black Monday in 1987, one could argue the AUD should trade with a perennial discount to fair value, in order to incorporate this risk.
For these reasons, we continue to take comfort from the protective benefits of our friend, the Australian dollar, even if over shorter periods we may have to endure a little pain.
(NB, the strengthening AUD impacted our Global fund returns by -2.9% in February)
*Source: Orbex
Wheelhouse Global Equity Income Fund
7.8%
Income over 3 years (p.a.)
6.6%
Total return 3 years (p.a.)
| 1 month | 1 year | 3 years (p.a.) | Since inception^ | |
| Income | 0.00% | 8.51% | 7.68% | 7.27% |
| Growth | (4.04%) | 1.20% | (1.30%) | (0.11%) |
| Total Return | (4.04%) | 9.72% | 6.55% | 7.16% |
| Benchmark* | (5.52%) | 18.33% | 13.82% | 12.31% |
| Risk (Beta)** | n/a | 0.62 | 0.45 | 0.60 |
Performance figures are net of fees and expenses.
* Benchmark is the MSCI World Index (ex-Australia).
** Risk is defined as Beta and sourced from Morningstar Direct. Beta is represented vs the Benchmark and vs the S&P/ASX 200 Index. A Beta of 1.00 represents equivalent market risk to the comparison Index. A minimum of 12 months data is required for the calculation.
^ Inception date is 26/05/2017. Since inception figures are calculated on a p.a. basis. Past performance is not an indicator of future performance.
Click here to read the full performance report of the Wheelhouse Global Equity Income Fund.
Wheelhouse Australian Enhanced Income Fund
9.2%
Income since inception (p.a.)
10.5%
Total return since inception (p.a.)
| 1 month | 3 months | 6 months | Since inception^ | |
| Income* | 1.80% | 2.58% | 4.39% | 9.22% |
| Growth | 2.28% | (4.76%) | (7.38%) | 1.28% |
| Total Return | 4.08% | (2.18%) | 2.99% | 10.50% |
| Benchmark** | 2.55% | (1.32%) | (3.30%) | 9.34% |
| Excess return | 1.53% | (0.86%) | 0.31% | 1.16% |
Performance numbers below are based on exit prices. Since inception returns include the 30bps exit spread.
* Income includes cash distributions and the value of franking credits and special dividends. Cash distributions are paid quarterly.
** Benchmark is the S&P/ASX 200 Franking Credit Adjusted Daily Total Return Index (Tax-Exempt).
^ Inception date is 9/03/2021. Since inception figures are calculated on a p.a. basis. Past performance is not an indicator of future performance.
Click here to read the full performance report of the Wheelhouse Australian Enhanced Income Fund.