- October 20, 2023
Seatbelts for a 1987 crash?
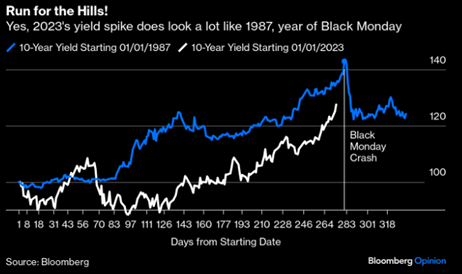
36 years to the day, Black Monday parallels are popping up.
Leading market commentators ranging from Shane Oliver at AMP, to John Authers at Bloomberg are drawing parallels with market conditions in the lead up to the October 1987 Black Monday crash, when markets fell over 20% in a day in both the US and Australia.
“As US bond yields surge ever higher, do you feel like you are in a car you just know is about to crash but are powerless to stop? All you can do is brace yourself and hope for the best.” Albert Edwards, Societe Generale Head of Global Strategy.
In this note, we’ll review the concerns and identify some possible seatbelts.
Most of the concern relates to the sharp pick in bond yields. As the chart from BCA shows, ‘financial accidents’ do tend to happen when yields spike higher, as they have recently.
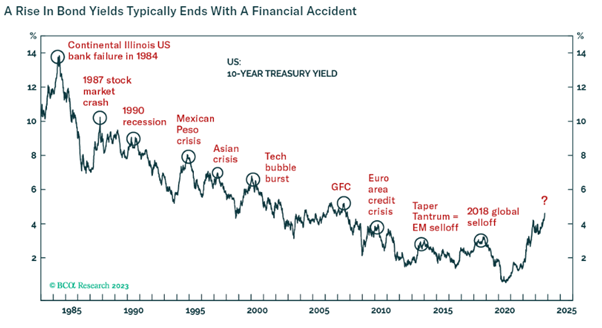
While bond yields are significantly lower than the 1980’s in an absolute sense, the ramp in yields seen this year appears very similar to the 1987 example.
So, what defensive strategies worked during the 1987 Black Monday crash, when sharemarkets in the US and Australia fell over 20% in a single day?
Bonds worked
As the above chart highlights, yields fell immediately (and bonds rose) once the market rout began. This is the negative correlation benefit that many balanced portfolios rely upon, although unfortunately as the 2022 simultaneous bear market in both equities and bonds showed, the defensive relationship is not always reliable.
However, given the recent pick up in yields, it seems probable that bonds would help steady the ship in a balanced portfolio, should something similar to a 1987 crash take hold.
The Australian dollar fell
No surprises, the Australian dollar fell. This has proven a highly reliable defensive benefit for Australian investors in global shares during market crises, with the Australian dollar falling near 7% from 19th October 1987 to month end.
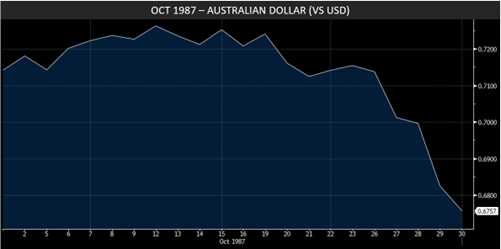
One note of caution however, is that the current trading level of the Australian dollar at 63c already represents a reasonable discount to fair value. Starting points matter, and this may mean the level of protection afforded may be a little less than expected.
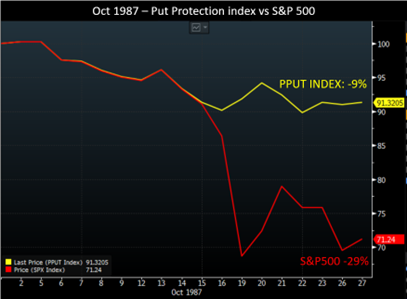
Tail hedging
Tail hedging has proven highly reliable in a crisis in our view. The chart below illustrates the ‘Protective Put’ index during October 1987, which combines owning exposure to the S&P500 with owning put options, struck 5% out of the money. Owning a put option is like owning insurance on the market, in case there is an aggressive sell off.
The strength of well constructed tail hedges like this is that the protection is more mechanical in nature and relies on no historical correlation to be effective, which is quite unlike the traditional bond/equity or AUD/equity defensive relationships.
This is what makes the approach so effective for sudden or acute drawdowns. Tail hedging also allows an investor to remain invested in a growth asset like equities, but with some inbuilt protection for aggressive sell offs.
Diversified protection
Like almost everything in investing, adding diversification helps. This applies to stock selection and asset allocation, as much as it applies to defensive strategies. Based on the 1987 experience, bonds may well retain their position as the primary defensive ballast within a portfolio during a crisis. However, the recent unreliability of this protection suggests to us that adding some meaningful diversification, that has no reliance on historical correlations, makes sense.
Of note, the PPUT index in Australian dollars (unhedged on currency) would have been close to flat for the month of October 1987…an amazing result given the pain felt elsewhere in markets globally. It’s easy to see how effective these defensive approaches can be when applied as a combination.
Whether a 1987-style ‘break’ occurs remains impossible to predict with certainty (like all things in investing), although there does appear to be some ingredients in place. When combined with slowing economic growth and geopolitical strife, now appears the ideal time to check one’s portfolio and ensure effective and diversified risk management is in place!
Wheelhouse Australian Enhanced Income Fund - Recommended!

We are pleased to announce that Lonsec has initiated coverage of the fund with a ‘Recommended’ rating.
The Wheelhouse Australian Enhanced Income Fund is an income focused Australian Equity fund. The Fund is managed with a risk targeted approach and seeks to deliver a similar risk exposure to the S&P/ASX200 Index.
Despite similar risk, the Fund is internally geared with a target underlying gross exposure of up to 200%. As a result, the Fund has the potential to receive up to 2x the dividends and franking vs the S&P/ASX200..
The Fund targets outperformance of its benchmark, the S&P/ASX200 Franking Credit Adjusted Daily Total Return Index (Tax-Exempt), which is designed to provide a measure of after-tax returns from the underlying S&P/ASX200 Index.
To find out more or for a copy of the Lonsec report please contact Wayne McGauley
Inaugural Webinar - Creating True Portfolio Diversification
We recently hosted our first webinar, “Creating True Portfolio Diversification”. In an interesting discussion Wheelhouse Partners’ Alastair MacLeod and leading independent asset consultant Michael Furey of Delta Research & Advisory discussed the importance of diversifying sources of return to reduce risk and the key role alternative investment strategies play to create true portfolio diversification.
The discussion covered Delta Research’s recent study on portfolio diversification and the various risk factors in common with many leading funds inhibiting portfolio diversification. Discussions also covered the Wheelhouse Global fund and the fund’s unique attributes which deliver true portfolio diversification.
Michael says, “The direction of the equity market is NOT the key driver of the Wheelhouse Global fund which demonstrates very low co-variance with major asset classes and also other funds, this is a key attribute as this demonstrates Wheelhouse Global making a genuine contribution to increase a portfolio’s diversification and lower overall portfolio risk.”
He also notes that, “A significant amount of an investor’s portfolio resides in funds largely dependent upon the same underlying factors that drive key asset classes thereby not providing true portfolio diversification – it’s a real risk in this environment.”
Please contact Wayne McGauley if you have any questions about the webinar.
Investor Notice
Please be advised that on the 12th September an email was sent with the title “Constructing portfolio diversity – new research report with Delta Research”. This email neglected to include the standard disclaimer, which reads as follows:
This communication has been prepared and issued by Wheelhouse Investment Partners Pty Ltd (ABN 26 618 156 200, AFSL 541 328). It is general information only and is not intended to provide you with financial advice or take into account your objectives, financial situation or needs. Past performance is not a reliable indicator of future performance. You should consider, with a financial adviser, whether the information is suitable for your circumstances. To the extent permitted by law, no liability is accepted for any loss or damage as a result of any reliance on this information. The product disclosure statement (PDS) for the Wheelhouse Global Fund, issued by The Trust Company (RE Services) Limited (ABN 45 003 278 831, AFSL 235150) as the responsible entity of the fund, should be considered before deciding whether to acquire or hold units in the fund. The PDS and Target Market Determination (TMD) can be obtained by calling +61 7 3041 4224 or visiting www.wheelhouse-partners.com. No company in the Perpetual Group (Perpetual Limited ABN 86 000 431 827 and its subsidiaries) guarantees the performance of any fund or the return of an investor’s capital.
If you have any questions or concerns about this communication please contact us on enquiries@wheelhouse-partners.
Wheelhouse Global Fund
7.6%
Volatility since inception p.a.
5.8%
Total return since inception p.a.
| 1 mo | 3 mo | 6 mo | 1 yr | 3 yrs (pa) | 5 yrs (pa) | S/I (pa) | |
| Total fund return | -3.5% | -3.7% | 2.5% | 7.0% | 3.9% | 4.1% | 5.8% |
| RBA+2.5%* | 0.5% | 1.7% | 3.3% | 6.2% | 4.0% | 3.8% | 3.9% |
| Risk (volatility) | – | – | – | 7.7% | 7.5% | 7.8% | 7.6% |
* The Fund’s benchmark is RBA +2.5% and is used for all time periods shown. From the Fund’s inception to 31 August 2023 the Fund’s benchmark was MSCI World ex Australia Index (AUD). The change in benchmark does not impact any fees the manager may earn and the Fund’s investment objective has not changed.
Performance figures are net of fees and expenses. Inception date is 26 May 2017. Past fund performance is not indicative of future performance.
Performance Update
Performance for our Global strategy continues to be impacted by the underperformance of the global Quality index which the equity portfolio is based upon, which does not own the seven mega-cap tech names in size (the ‘Magnificent-7’) and is more equal weighted in nature.
Year to date this drag is now approaching 12%, without which the performance of the Fund would be much closer to our targeted 8% annual return for 8% volatility since inception. While painful in the short-term, we believe the returns from a more equal weighted Quality exposure will turnaround and help reverse this performance drag… we just can’t say when. Historically this has often occurred during genuine economic slowdowns… so perhaps watch this space.
Wheelhouse Australian Fund
10.9%
Income since inception p.a.
6.0%
Total return since inception p.a.
| 1 mo | 3 mo | 6 mo | 1 yr | S/I pa^ | |
| Income* | 2.1% | 2.7% | 4.2% | 9.5% | 10.9% |
| Growth | -4.6% | -3.9% | -3.6% | 2.9% | -4.9% |
| Total Return | -2.5% | -1.2% | 0.6% | 12.4% | 6.0% |
| Benchmark** | -2.6% | -0.3% | 0.9% | 15.1% | 7.4% |
Performance figures are net of fees and expenses. Since inception numbers include 30bps exit spread.
* Income includes cash distributions and the value of franking credits and special dividends. Cash distributions are paid quarterly.
** Benchmark is the S&P/ASX 200 Franking Credit Adjusted Daily Total Return Index (Tax-Exempt).
^ Inception date is 09/03/2021. Since inception figures are calculated on a p.a. basis. Past performance is not an indicator of future performance.
For any questions or enquiries about our funds or investment strategies, please contact Wayne McGauley, Head of Distribution, via wayne.mcgauley@wheelhouse-