- September 20, 2023
Time to lose weight?
US market forecasters have had a tough year. Unless they possessed incredible vision on the impact of AI and the associated market euphoria that this created for a handful of stocks, analysts are now busy ratcheting up their year-end forecasts so as not to be too far behind where the market already is trading.
The fact that a handful of stocks prove moonshots and deliver most of the markets gains is not new. However, what is different this year is the massive weights of these winners in the market-cap weighted indexes, which is creating a tale of two markets; the haves (own Magnificent or Mega-7, in size) and have nots.
This is well illustrated when comparing the returns from the market cap weighted indexes, versus their equal weighted cousins.
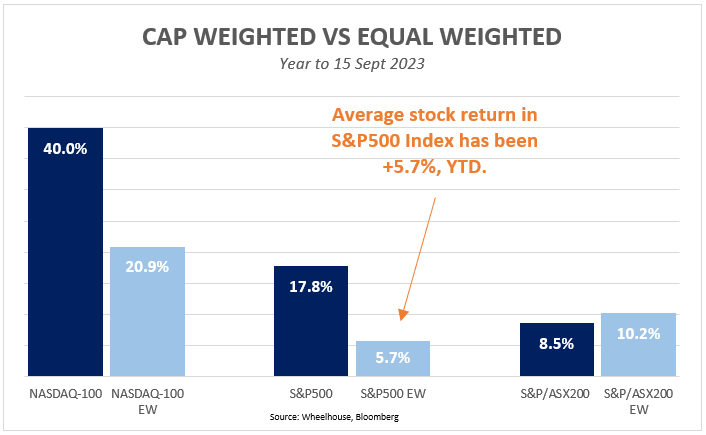
What pops off the chart is that for an investor simply focused on the US market, the average US stock has returned +5.7% year to date, dwarfed by the cap-weighted Nasdaq 100 pushing over +40%.
With a shortage of mega-cap AI exposed names in Australia, we simply do not have this dispersion (and forecasters have been generally more on point!)
Alas, market forecasters in the US would have been much nearer the pin if the market return was simply much closer to the average stock return of only +5.4%. Manias continue to prove difficult to forecast.
The case for equal weighted indexes
This level of divergence between cap weighted and equal weighted indexes is unusual in its magnitude. It’s also worth highlighting that historically at least, equal weighted indexes have generally outperformed capitalisation weighted.
So is it time to move equal weighted? Some considerations:
Valuation
Valuations in aggregate are more attractive for the S&P500 Equal Weighted index, which should come as no surprise with the major growth names de-weighted.
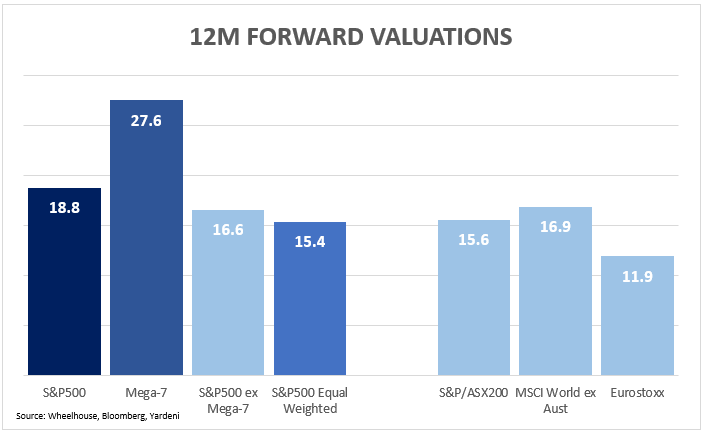
Interestingly, the Equal Weight version of the S&P500 is even cheaper than the ‘ex-Mega-7’ adjusted version.
As a result, the forward PE valuation of 15.4x appears much more supportive than the cap weighted 18.8x, and far closer to valuations of the local Australian market.
We’d highlight this is simply looking at valuations and is not taking into account the different growth outlooks for the different indexes, which would certainly change without the higher-growth mega-tech names.
Small cap bias
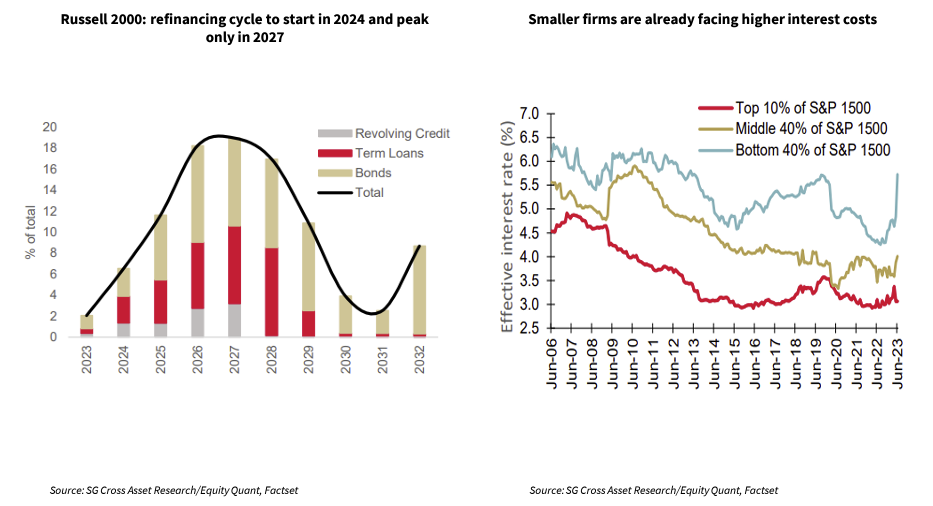
One of the reasons put forward to explain why equal weighted indexes have historically outperformed, is that they consistently overweight smaller capitalisation stocks. There is strong evidence globally that over time, smaller companies tend to outperform larger (although this appears contrary to the Australian experience).
Across all regions however, smallcaps are generally more exposed to the economic cycle and more sensitive to higher interest rates (as their balance sheets are in general, much weaker than larger companies with better access to capital.)
Should a bona fide recession arrive in the US, this may cause problems for smaller companies and thus, the equal weighted index. Although arguably this risk is at least partially discounted by valuations and already conservative earnings forecasts, so perhaps more one for contrarians at this point.
Risk management
As a risk targeting investor, one of the most compelling reasons for applying a more equal weighted approach is to avoid the concentration risks that cap-weighted indexes currently present.
The 7 stocks making up the Mega-7 complex currently account for 27% of the S&P 500 market capitalisation, with the combined exposure all sharing a similar fundamental recent driver (AI euphoria) along with all posting sharply elevated valuations.
Make no mistake, these business are generally regarded as fantastic and generally also enjoy exceptionally solid balance sheets… equally they have also all popped on a similar driver – their perceived exposure to AI, so clearly also share some common risks.
Conclusion
2023 has so far proven that yet again, forecasting is exceptionally difficult to consistently get right. In this instance, the performance of 7 stocks driving over 10% of the market’s returns.
There are benefits in owning an equal weighted exposure at this point such as attractive valuations and minimising concentration risk. However, there are also risks, with a greater weight to small caps (and their typically weaker balance sheets) comes a greater sensitivity to an aggressive economic slowdown were one to appear.
One solution to keep the benefits and remove the weakness of an equal weighted portfolio would be to introduce Quality into the portfolio. Quality filters typically screen out weaker balance sheets, along with more cyclical earnings exposures.
Our Global fund relies on a Quality index with 1-2% weights. As a result, the returns of the underlying equity portfolio have been similar to equal weighted indexes as we don’t own large exposures to the Mega 7, nor do we have the associated out-sized stock specific concentrations. This approach misses some of the highs, but more importantly also misses the lows and is much more aligned with our risk targeting strategy of seeking 8% returns for less than 8% volatility.
New Research Report from Delta Research & Advisory
We recently commissioned Michael Furey of Delta Research & Advisory to undertake an in-depth study of portfolio diversification attributed to leading Funds across various asset classes. The aim was to better understand the underlying drivers of Fund returns and determine whether true diversification was being achieved.
The report shows that many funds are not providing genuine diversification for portfolios because they share a common underlying source of return. And also highlighted the important role Alternatives can play in sourcing returns from non-traditional investments and deliver a return profile that is unrelated to conventional asset classes.
Webinar Exclusive

We’re hosting a Q&A with Michael Furey to discuss the research paper as well as the outlook for financial markets and the implications for portfolio construction.
Date: 10am AEDT
Time: Thursday, 5th of October
Wheelhouse Global Fund
7.5%
Volatility since inception p.a.
6.5%
Total return since inception p.a.
| 1 mo | 3 mo | 6 mo | 1 yr | 3 yrs (pa) | 5 yrs (pa) | S/I (pa) | |
| Total fund return | (0.8%) | 0.5% | 2.5% | 10.5% | 5.9% | 5.0% | 6.5% |
| RBA+2.5%* | 0.6% | 1.7% | 3.3% | 6.0% | 3.9% | 3.7% | 3.8% |
| Risk (volatility) | – | – | – | 6.4% | 7.2% |
* The Fund’s benchmark is RBA +2.5% and is used for all time periods shown. From the Fund’s inception to 31 August 2023 the Fund’s benchmark was MSCI World ex Australia Index (AUD). The change in benchmark does not impact any fees the manager may earn and the Fund’s investment objective has not changed.
Performance figures are net of fees and expenses. Inception date is 26 May 2017. Past fund performance is not indicative of future performance.
Wheelhouse Australian Fund
10.5%
Income since inception p.a.
7.3%
Total return since inception p.a.
| 1 mo | 3 mo | 6 mo | 1 yr | S/I pa^ | |
| Income* | 0.5% | 1.7% | 4.9% | 10.4% | 10.5% |
| Growth | (0.9%) | 1.7% | (1.7%) | (1.1%) | (3.2%) |
| Total Return | (0.4%) | 3.4% | 3.2% | 9.3% | 7.3% |
| Benchmark** | (0.5%) | 4.2% | 3.8% | 11.4% | 8.8% |
Performance figures are net of fees and expenses. Since inception numbers include 30bps exit spread.
* Income includes cash distributions and the value of franking credits and special dividends. Cash distributions are paid quarterly.
** Benchmark is the S&P/ASX 200 Franking Credit Adjusted Daily Total Return Index (Tax-Exempt).
^ Inception date is 09/03/2021. Since inception figures are calculated on a p.a. basis. Past performance is not an indicator of future performance.