- December 16, 2022
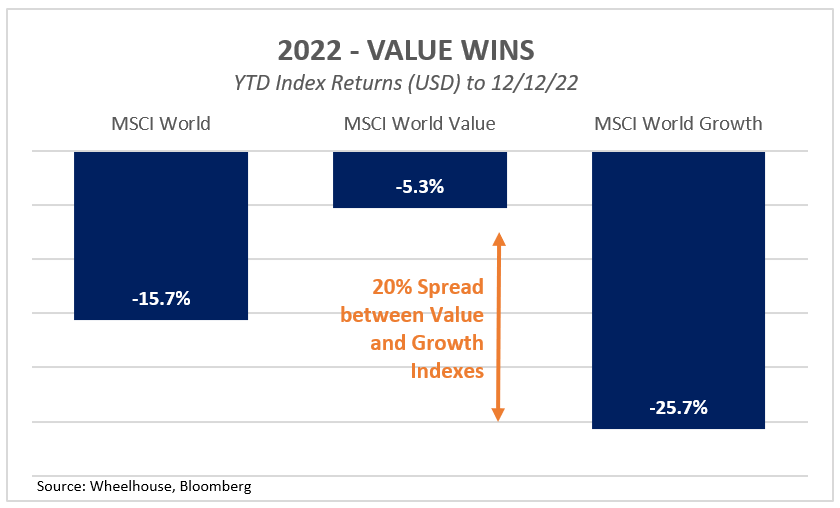
In a tough year, Value sparkled.
Particularly relative to its main adversary Growth, Value cleaned up and outperformed by 20%. This makes 2022 one of the best relative returns vs Growth over the past 40 years, bettered only by the outperformance Value delivered in year 2000 during the tech bubble meltdown.
In this newsletter we review historical returns and future expectations for Value vs Growth, and introduce a third way – Quality – which may provide a better path.
US vs international equity markets
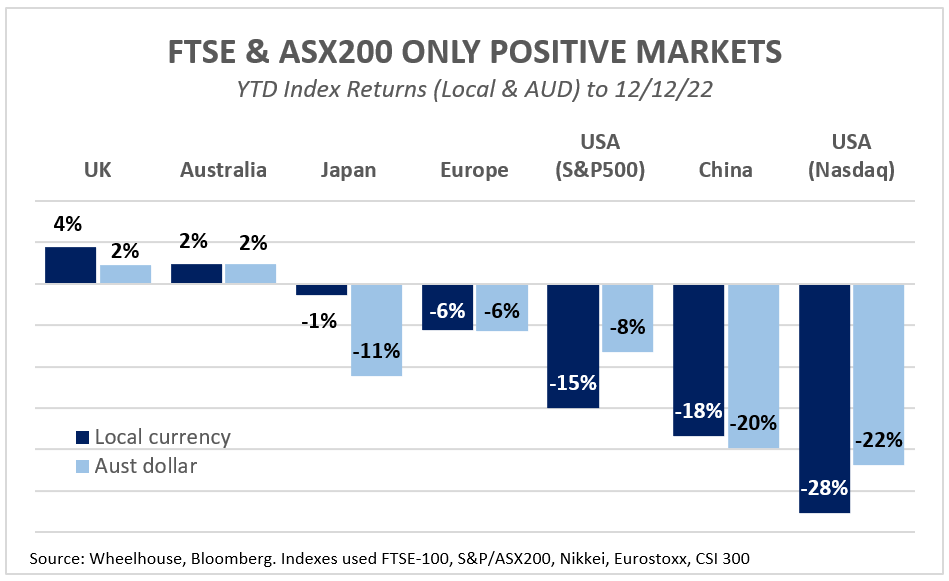
This wide style-bias dispersion also showed up in the returns of Global sharemarkets. Value-weighted Indexes like the UK, Australia, Japan and Europe performed much better than US exposures, especially technology-heavy exposures like the Nasdaq. As we flagged in December last year, the FTSE is a ‘value investors playground’, which delivered in spades for investors during 2022.
Sector returns also leaned Value
From a sector return perspective, the more traditional Value sectors also performed well. In the table below we review the sector returns of the S&P500 and compare the valuation compression (in 12m-forward P/E) with the implied earnings change.
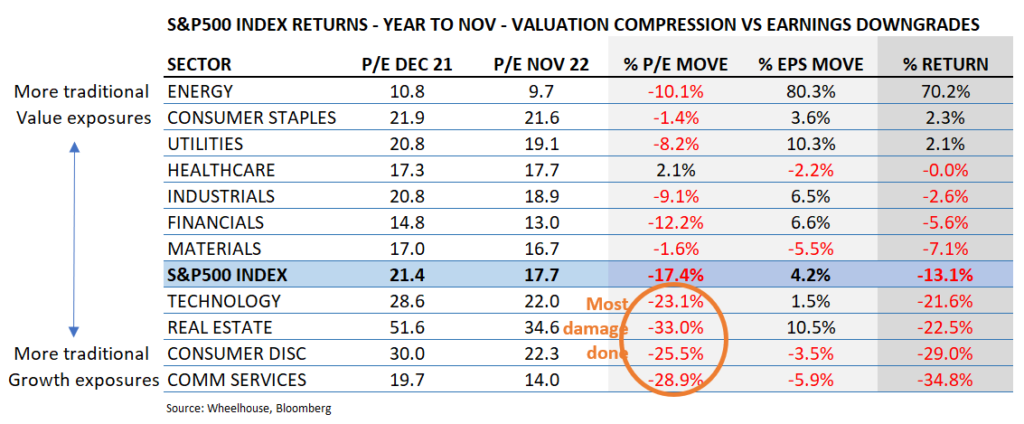
As the chart above highlights, the drawdown in Global markets so far is more due to a collapse in multiples for the Growthier and more expensive sectors, with the more traditional Value exposures relatively unharmed (in many cases) from much valuation compression. As is typical for equity markets, earnings were relatively stable (with the exception of Energy!) when compared to the dramatic shift in valuations. Simply owning Value would have helped avoid many of these falling knives!
Can Value continue to outperform? Three points to consider:
(1) Long-term excess return from Value versus factor volatility
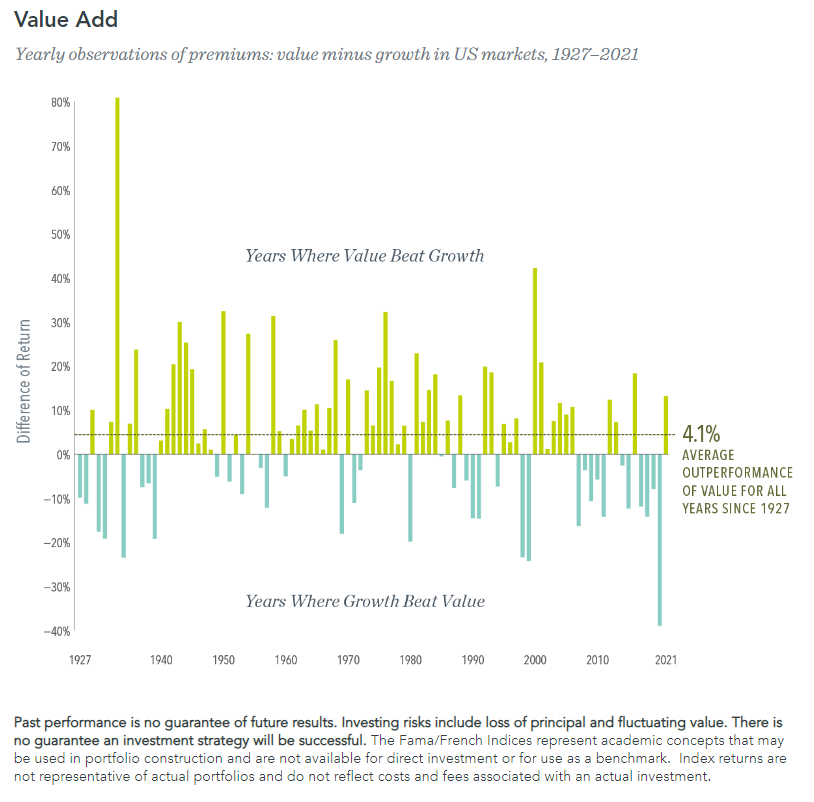
Longer-term research by Fama/French back to 1927 has highlighted excess returns available from targeting the Value or the otherwise named HML (High minus Low) factor. Fund manager Dimensional have calculated the excess returns from Value in the US market over this near 100 year period to be over 4% annually, although from a review of the chart below, much of this outperformance was delivered prior to 1980.
We can only speculate as to why Value seems to have been less effective the past 40 years. It may be either due to the secular decline in interest rates (we discuss below), or perhaps due to the wider recognition and adoption of Value-targeting strategies by professional investors.
A review of MSCI style indexes reinforces this more recent trend. These indexes have only been around for 40 years and are based on Global markets (not just the US like above chart). They also suggest that since 1980 the Value factor has struggled to deliver material excess return.
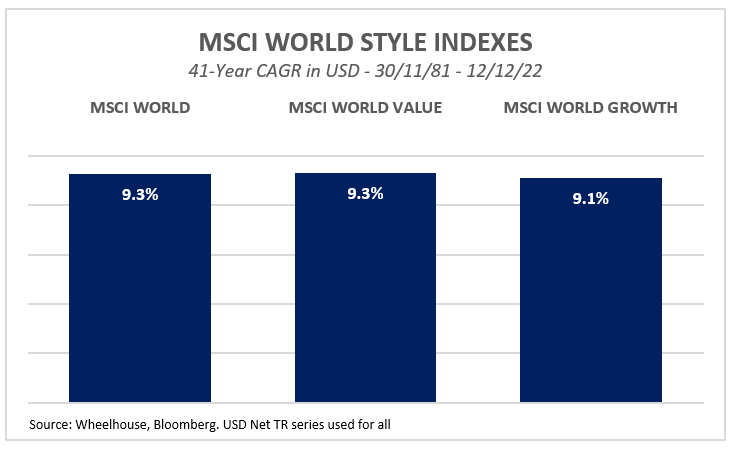
Regardless of excess return, what is apparent from Value’s performance during 2022, plus the year by year series above, is that large bets on Value or Growth can drive meaningful performance differences over shorter periods, which would often dominate the total return of the strategy.
Despite the large short-term swings, the Value/Growth series does seem to mostly mean revert over time, even allowing for some Value excess return premium. A better strategy may be to tactically lean into Value or Growth at times of extreme dislocation, perhaps similar to the market environment post Covid when many where pointing to an extreme valuation spread in favour of Value. Although we’d highlight that the Value spread looked attractive for many years prior to 2022, yet continued to widen, so there’s no easy runs here.
Regardless of how material the Value premium is likely to be in the future, the large swings in performance will likely add stress to the investment journey and may make it difficult for investors to hold their nerve during the inevitable bad times.
(2) Interest rate cycle
One of the reasons attributed to Value’s recent outperformance is that Value is a relative beneficiary of rising interest rates. This view is based on the generally cheaper valuations found within Value and shorter duration versus the broader market.
As inflation looks to have peaked, should rates start falling later next year will Value struggle again?
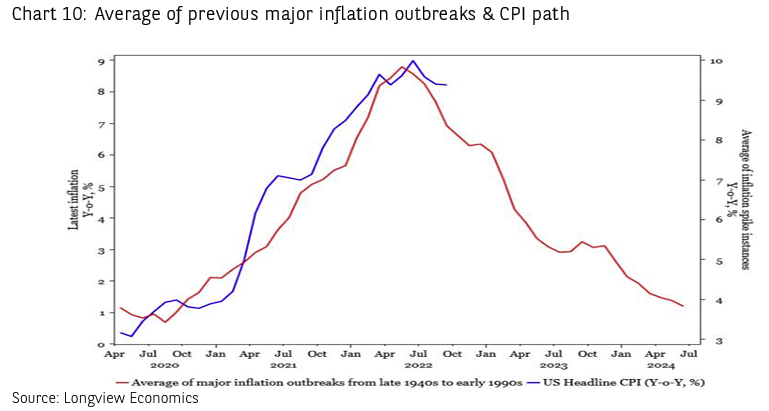
There are differing views on how correlated Value is to interest rates, despite recent returns. Well-regarded manager AQR concludes that while correlations between interest rates and Value have been materially increasing over the past 5 years, the longer-term relationship shows little substance. This argument may go some ways to countering the view that the 40-year secular decline in interest rates has counted against Value outperformance.
While fundamentally we believe predicting short-term factor returns is a tough day job, it seems hard to go past the more recent correlations and dismiss the view that a falling interest environment (whenever it arrives) would not create some relative tailwinds for Growth (and headwinds for Value). Like all things it depends on the circumstances. If interest rates end up being cut aggressively to offset a contracting economy, then other considerations will come into play… namely earnings stability.
(3) Economic contraction and variances within Value
Is Value better suited to a genuine earnings recession? It seems to us it depends upon who you ask! Value meaningfully underperformed during Covid, although there were unusual circumstances with the massive change to consumer behaviour and routine. So there is no hard and fast rule here and the circumstances matter.
Within Value there are more cyclical earnings exposures (like Energy, Materials and Financials), and more stable exposures (like Healthcare and Consumer Staples). It makes sense that the more defensive earnings exposures should hold up far better during a genuine earnings recession. Although judging from the valuation table above where multiples for Healthcare and Staples have hardly moved, it seems the market is doing a reasonable job of anticipating (and pricing) the reliability of these earnings streams.
As a result, investors’ definition of Value when expressed through active management, may be very different to the broader return from the factor. The implementation of Value can be very nuanced across different managers.
So long or short Value?
To sum up, we believe Value or Growth investing should be considered a big bet and one that can materially affect shorter-term returns. Depending upon the path of interest rates in 2023, Value may experience some relative headwinds should the interest rate cycle turn more dovish and inflation continues to cool. Also, perhaps there is some merit in the argument that the longer-term excess return from Value may be less than what it once was, before the strategy was more widely adopted and the premium targeted by professional investors.
Either way, we believe there is a better path. We prefer to favour Quality, as opposed to Value or Growth.
Quality is a less dramatic factor or characteristic that doesn’t neatly fit into either Value or Growth and tends to be less dominant than either. Similar to Value, there is also meaningful longer-term academic research (from Fama/French and others) that supports an excess return from this factor.
Indeed, over the same forty-year period that we plotted the MSCI style indexes above, Quality has genuinely shone, despite some small recent underperformance the last 18 months.
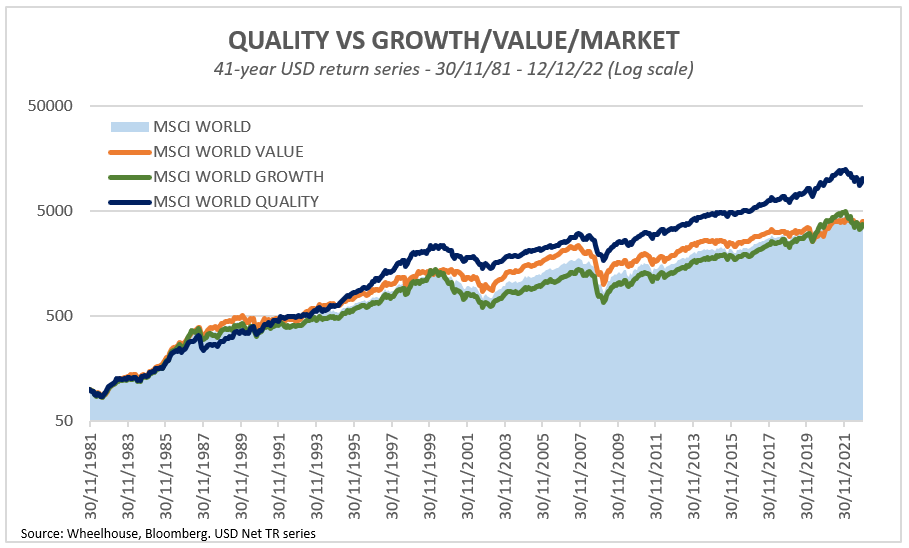
While there remains no universal definition of Quality, three key ingredients are usually (1) Balance Sheet strength, (2) high Return on Equity, and (3) stable Margins. Should we enter a genuine earnings recession where Balance Sheets and more stable earnings are prized, we feel the exposure is a much safer place to be with far fewer of the roundabouts and heartache from the Value/Growth trade.
*Our Global fund relies on a strong Quality-skewed underlying portfolio, with little Value or Growth tilt. Our Australian fund includes zero factor exposures.
Wheelhouse Global Equity Income Fund
7.8%
Income over 5 years (p.a.)
6.7%
Total return 5 years (p.a.)
| 1 month | 1 year | 1 year | 3 years (p.a.) | Since inception^ | |
| Income | 0.0% | 7.5% | 7.6% | 7.8% | 7.4% |
| Growth | 2.5% | (7.2%) | (3.6%) | (1.1%) | (0.5%) |
| Total Return | 2.5% | 0.3% | 4.0% | 6.7% | 6.9% |
| RBA + 2.5% | 0.5% | 3.6% | 3.0% | 3.4% | 3.4% |
| Benchmark* | 2.0% | (5.9%) | 7.9% | 10.1% | 10.6% |
| Market Risk** | nm | 0.5 | 0.4 | 0.5 | 0.6 |
Performance figures are net of fees and expenses.
* Benchmark is the MSCI World Index (ex-Australia).
** Risk is defined as Beta and sourced from Morningstar Direct. Beta is represented vs the Benchmark and vs the S&P/ASX 200 Index. A Beta of 1.00 represents equivalent market risk to the comparison Index. A minimum of 12 months data is required for the calculation.
^ Inception date is 26/05/2017. Since inception figures are calculated on a p.a. basis. Past performance is not an indicator of future performance.
Click here to read the full performance report of the Wheelhouse Global Equity Income Fund.
Wheelhouse Australian Enhanced Income Fund
11.4%
Income since inception p.a.
8.4%
Total return since inception p.a.
| 1 month | 3 months | 6 months | 1 year | Since inception^ | |
| Income* | 0.4% | 3.8% | 7.0% | 12.5% | 11.4% |
| Growth | 5.2% | 1.8% | (6.5%) | (10.8%) | (3.0%) |
| Total Return | 5.6% | 5.6% | 0.5% | 1.8% | 8.4% |
| Benchmark** | 6.8% | 6.8% | 4.4% | 6.7% | 10.2% |
| Excess return | (1.2%) | (1.2%) | (3.9%) | (4.9%) | (1.8%) |
Performance figures are net of fees and expenses.
* Income includes cash distributions and the value of franking credits and special dividends. Cash distributions are paid quarterly.
** Benchmark is the S&P/ASX 200 Franking Credit Adjusted Daily Total Return Index (Tax-Exempt).
^ Inception date is 9/03/2021. Since inception figures are calculated on a p.a. basis. Past performance is not an indicator of future performance.
Click here to read the full performance report of the Wheelhouse Australian Enhanced Income Fund.

