- January 12, 2022
The most important driver for markets in 2022?
Astrology followers would know that January is the time for market experts to give their view on sharemarket returns for the next 12 months. The table below summarises market forecasts for the Australian and US markets, although a table format robs investors of the colourful storylines for how we will get there.
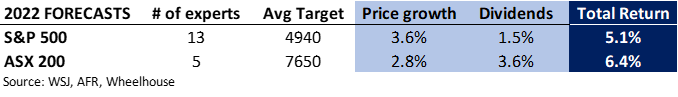
Mid-single digit returns may appear fairly ordinary in the light of recent sharemarket gains, with the US market averaging 26% per year the past three years and the ASX 200 averaging 14% (dividends included). However, as flagged in our October report, institutions have been forecasting for some time to prepare for lower growth equity returns ahead, in order to bring returns closer to their longer-term averages of 9-10%.
The critical ingredient for equity growth
All bull cases for equities that we have seen share a central theme – that continued robust earnings growth will outweigh headwinds from rising bond yields and more hawkish central banks.
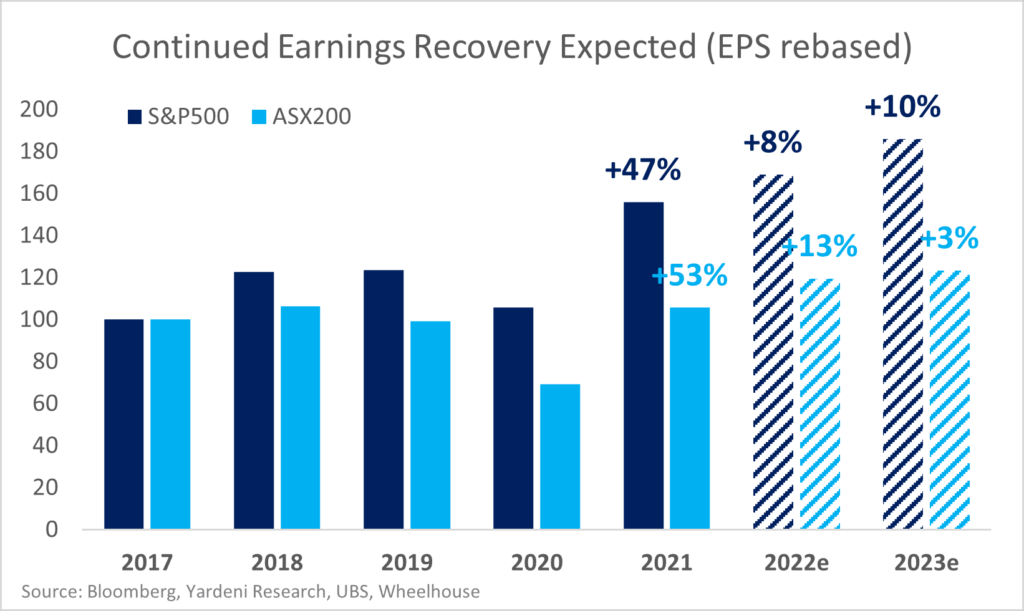
Indeed, earnings growth powered the market during 2021, with corporate earnings jumping 47% for the S&P 500 off pandemic lows. This time last year the market was only expecting 20% growth for 2021 in the US, thus delivering an environment this past 12 months of continual earnings beats every reporting season. Market strategists expect this growth to continue into 2022, with 8% growth for the S&P 500 and nearer 13% growth for the ASX 200, with Australian growth assisted by the reopening of lockdown affected Sydney and Melbourne.
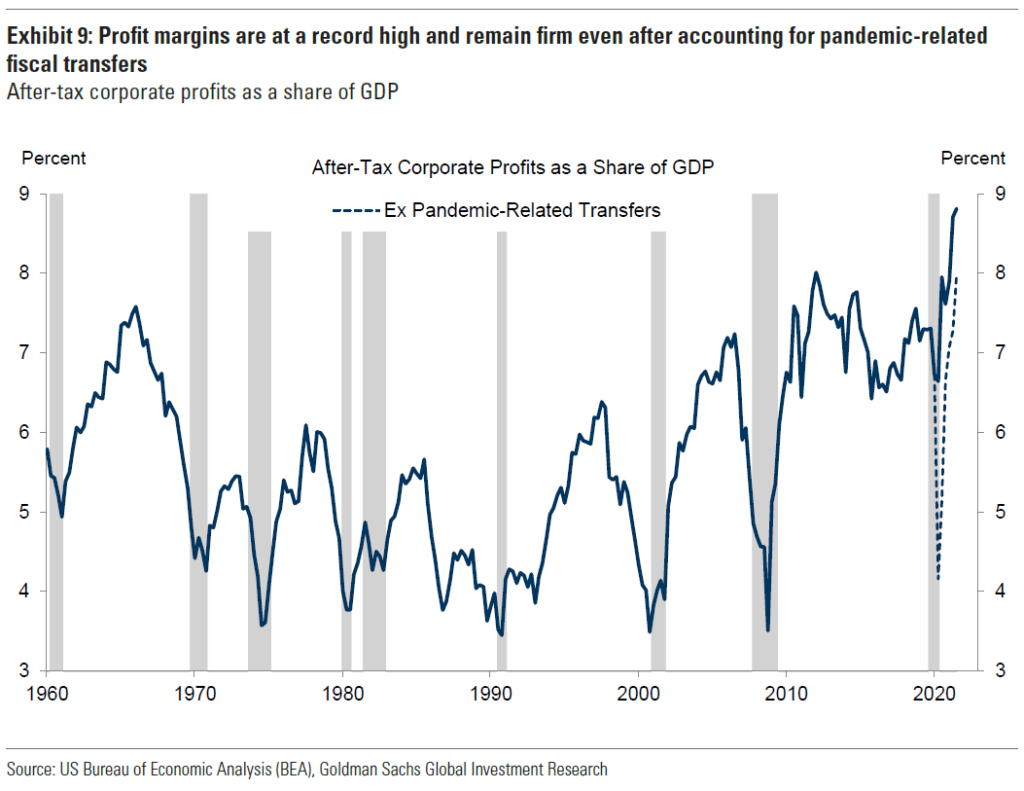
Embedded in these robust earnings forecasts is a continued boom in profit margins. Despite supply chain issues dominating the headlines, corporate profitability soared on post pandemic revenue growth coupled with lean cost bases. Profits in the US are now at their highest levels ever when compared with underlying GDP.
Looking forward, the underlying premise for further earnings growth appears to be continued re-opening of global economies, which translates into continued margin expansion and profit growth. One concern with this assumption might be that the lean cost bases that have helped generate outsized profitability are unlikely to last forever. The same forces that help propel re-opening and reflation, are also likely to drive more material cost inflation than that witnessed in 2021.
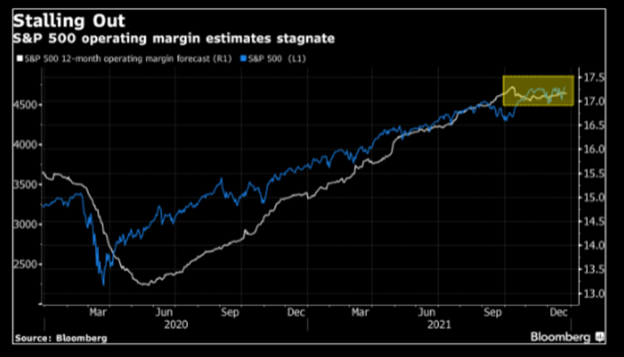
Indeed, profitability in the US looks to have stabilised the past few months. According to Goldman Sachs research, margins for every sector except energy and chemicals have either stabilised or fallen during this recent period. While profit forecasts may still be achieved, we’d argue the ‘beat and raise’ environment of 2021 is largely behind us.
This change in environment may be where market forecasts come unstuck, as earnings represent only one side of expected future returns. The other side is the price, or what the market is willing to pay for robust earnings growth. Should ‘market beating’ earnings growth prove a little harder to deliver, then perhaps the scales might tip a little in favour of concern about rising bond yields and the unwind of unconventional monetary policy. At 21x valuation multiples in the US for 2022, and 18x in Australia, there seems a lot riding on robust earnings growth being delivered.
Not all doom and gloom – three areas of opportunity
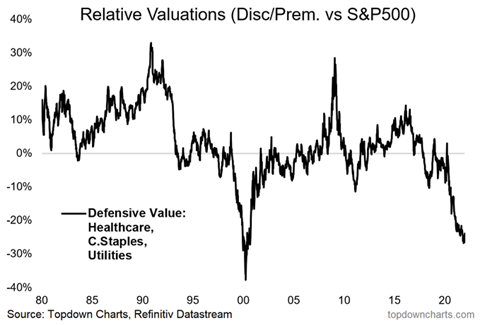
Not all stocks and sectors were swept along with the beat and raise euphoria, and one unloved segment of the market has seen this movie before. ‘Defensive equity’, defined as Healthcare, Staples and Utilities, has not been cheaper relative to the broader market with the exception of the period immediate before the year 2000 tech correction.
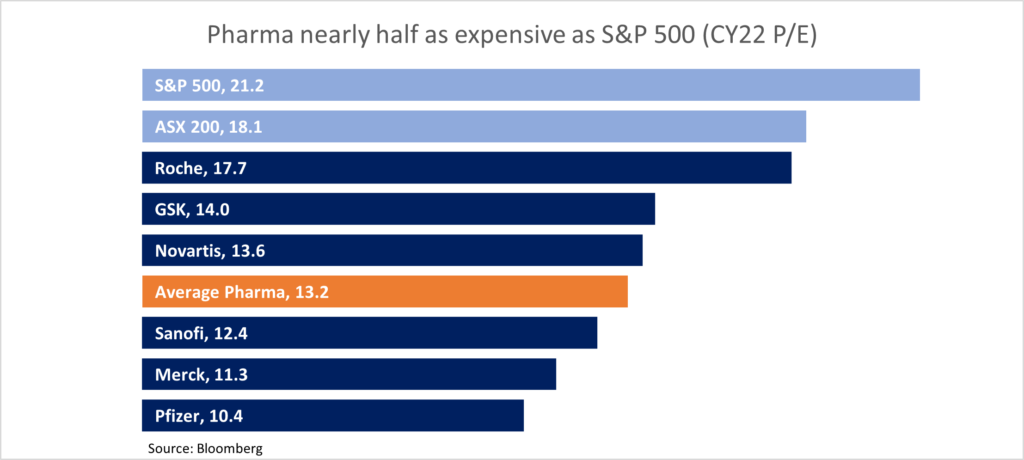
Looking specifically at large pharmaceutical companies, this cheapness is reflected in the valuation multiples of many of these stocks which are trading for around half the price of the broader market but with generally stable margins through all historical market conditions. While Healthcare has underperformed materially during the post pandemic low-quality rally (and our Global fund has a consistent overweight to Healthcare), looking forward we believe the prospects are far brighter.
In a similar vein to Defensive equity, we would again highlight the prospects for the UK market. We have discussed in our October monthly but at 4% yield, a 12x PE, and effectively zero technology exposure, the FTSE-100 index screens as a highly contrarian and unloved defensive corner of the market, or at the very least a happy hunting ground for bargain seeking investors.
The final opportunity we believe will likely deliver healthy returns even should earnings disappoint, are highly income generative strategies. Should the experts be proven correct and growth is indeed lower than average the next few years, then the merit of income strategies that rely far less on capital growth to generate equity like returns, should become increasingly valuable to investors.
Wheelhouse Global Equity Income Fund
8.1%
Income over 3 years (p.a.)
9.7%
Total return over 3 years (p.a.)
| 1 month | 1 year | 3 years (p.a.) | Since inception^ | |
| Income | 1.72% | 8.83% | 8.09% | 7.60% |
| Growth | (1.35%) | 5.03% | 1.64% | 0.69% |
| Total Return | 0.37% | 13.87% | 9.73% | 8.28% |
| Benchmark* | 1.68% | 29.58% | 20.58% | 14.72% |
| Risk (Beta)** | n/a | 0.69 | 0.45 | 0.60 |
Performance figures are net of fees and expenses.
* Benchmark is the MSCI World Index (ex-Australia).
** Risk is defined as Beta and sourced from Morningstar Direct. Beta is represented vs the Benchmark and vs the S&P/ASX 200 Index. A Beta of 1.00 represents equivalent market risk to the comparison Index. A minimum of 12 months data is required for the calculation.
^ Inception date is 26/05/2017. Since inception figures are calculated on a p.a. basis. Past performance is not an indicator of future performance.
Click here to read the full performance report of the Wheelhouse Global Equity Income Fund.
Wheelhouse Australian Enhanced Income Fund
Performance numbers below are based on exit prices. Since inception returns include the 30bps exit spread.
| 1 month | 3 months | 6 months | Since inception^ | |
| Income* | 0.95% | 1.27% | 3.52% | 7.82% |
| Growth | 1.92% | 1.62% | 3.09% | 8.38% |
| Total Return | 2.87% | 2.90% | 6.61% | 16.20% |
| Benchmark** | 2.76% | 2.26% | 4.58% | 13.86% |
| Excess return | 0.11% | 0.64% | 2.03% | 2.34% |
Performance figures are net of fees and expenses.
* Income includes cash distributions and the value of franking credits and special dividends. Cash distributions are paid quarterly.
** Benchmark is the S&P/ASX 200 Franking Credit Adjusted Daily Total Return Index (Tax-Exempt).
^ Inception date is 9/03/2021. Since inception figures are calculated on a p.a. basis. Past performance is not an indicator of future performance.
Click here to read the full performance report of the Wheelhouse Australian Enhanced Income Fund.