- July 18, 2023
Happy 50th Black-Scholes!
One recent birthday that missed the celebrity pages was the 50th anniversary of the first ever option trade on an option exchange. While agricultural derivatives have been used for centuries, it wasn’t until 1973 and the publication of the Black-Scholes pricing model that the first listed option trade was cleared on the CBOE in Chicago.
The first trade? A familiar one in recent times… an investor bought call options on a large technology stock… Xerox.

Growth in options trading
The breakthrough of the Black-Scholes pricing model – while far from perfect – was that it provided a framework for all market participants to efficiently price and thus manage option risk. As a result, options trading volumes have grown massively since 1973.
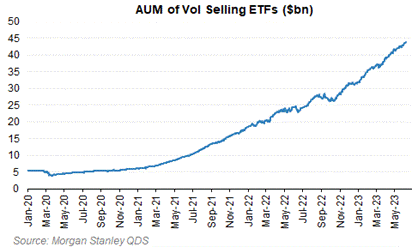
In recent times, option strategies have also seen robust growth. In the US, much of this growth has centred around covered call or ‘BuyWrite’ type strategies, although any option selling strategy would be included in the below data.

A good 'option' for low growth markets
One reason for the increased demand for overlay strategies is their proven performance in lower growth environments. As investors have come around to the view that equity market returns are likely to be more challenged in future years, demand has risen for strategies that historically have excelled in lower growth or potentially negative environments.
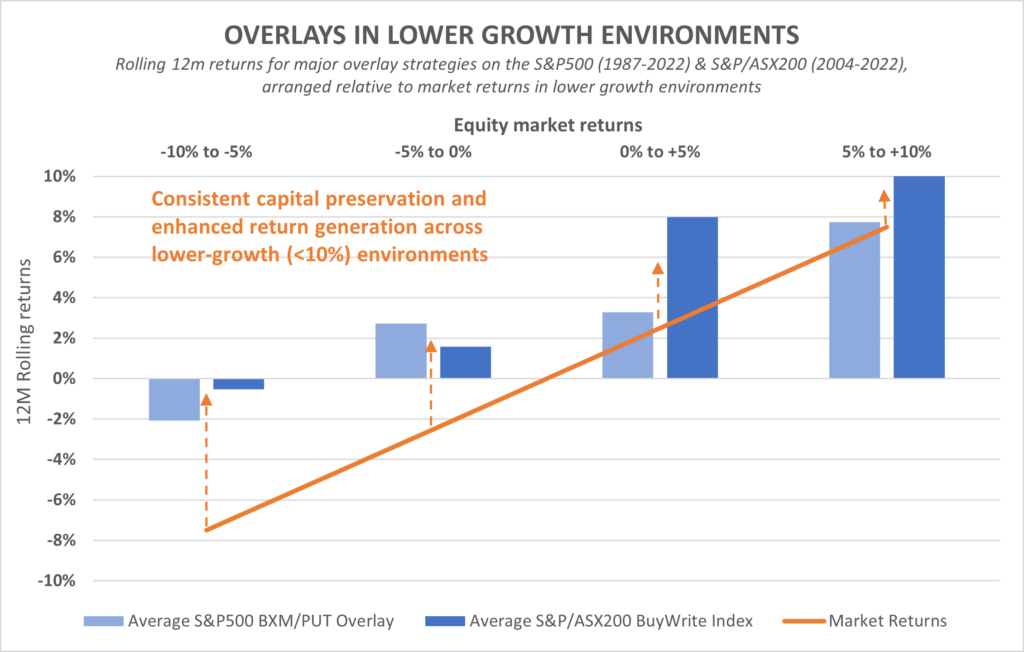
The main reason for this is that Overlay strategies receive a payment in exchange for upside capital participation. Thus the returns are enhanced in lower growth or more negative environments, but partially capped in strong markets.
In the chart below we’ve plotted historical 12m rolling returns for Overlay strategies on both the S&P 500 and the ASX200, relative to the equity benchmark for both.

As the chart highlights, systematic option overlay strategies have consistently delivered a more defensive return profile with improved real return generation in lower-growth environments. The quid pro quo for this lower-risk return profile is expected drag during more bullish (+10% annual) periods.
Risk targeting: Lower risk or market risk...
At Wheelhouse we specialise in risk-targeted overlay strategies, as we prize the outsized return for risk that these investment approaches have consistently delivered.
Whilst our Global fund has more of an absolute return objective, not everyone is suited to a strategy that is always playing defence. This is why we launched our Australian fund over 2 years ago, with an objective to retain a similar enhanced return in lower growth periods (the capture of twice the market’s franked dividend yield* helps deliver this), but also to fully participate in market rallies.
Perhaps our Australian fund plays more of a midfielder role than that of a fullback, with our risk-targeted funds designed to deliver reliable outcomes whatever an investor’s risk tolerance.
* To find out more on this unique feature of twice the market’s franked dividend yield please contact Wayne McGauley, Head of Distribution. Wayne can be reached on email at wayne.mcgauley@wheelhouse-
Distributions
On the 18th July 2023, the Wheelhouse funds will pay their final distributions for the 12 months to 30 June 2023. Details of the distributions and our expectations for future income returns can be found in our Wheelhouse Distribution letter.
In the news: Interview with Alastair MacLeod on ausbiz
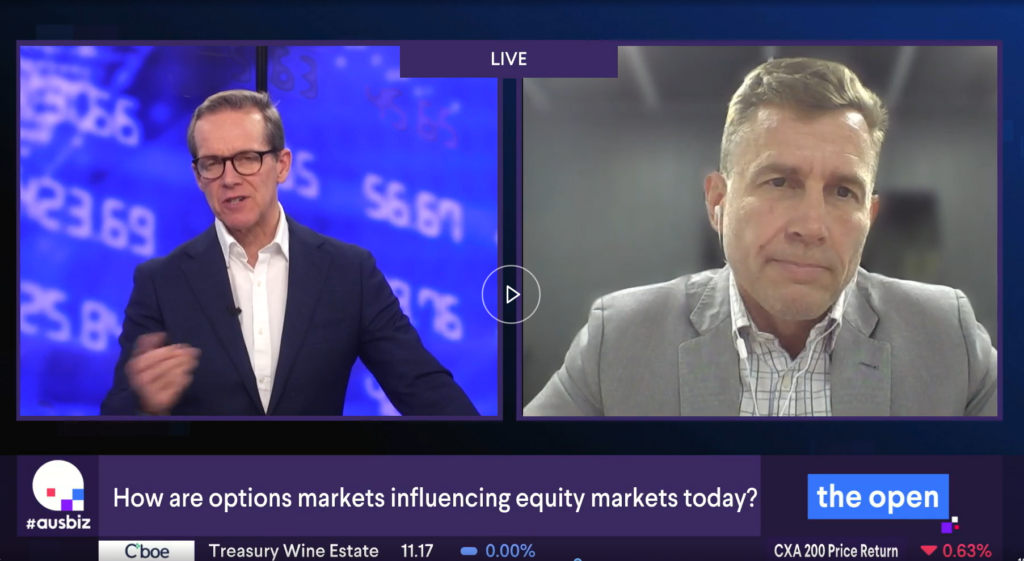
Watch Alastair MacLeod in a recent interview on ausbiz explaining why market volatility has been declining and how the options market has been influencing the equities market. [10mins]
Wheelhouse Global Equity Income Fund
7.6%
Income since inception p.a.
6.7%
Total return since inception p.a.
| 1 month | 1 year | 3 year p.a | 5 years p.a. | Since inception^ | |
| Income | 1.9% | 8.2% | 8.0% | 7.7% | 7.6% |
| Growth | (1.2%) | 2.8% | (2.7%) | (1.4%) | (0.9%) |
| Total Return | 0.7% | 10.9% | 5.3% | 6.3% | 6.7% |
| RBA +2.5% | 0.5% | 5.5% | 3.6% | 3.6% | 3.7% |
| Benchmark* | 3.1% | 22.6% | 13.5% | 11.5% | 11.4% |
| Market Risk** | nm | 0.5 | 0.5 | 0.5 | 0.5 |
Performance figures are net of fees and expenses.
* Benchmark is the MSCI World Index (ex-Australia). RBA +2.5% represents equity returns with half the Equity RIsk Premium.
** Market Risk is defined as Beta and sourced from Morningstar Direct. A Beta of 1.00 represents equivalent marketrisk to the Benchmark. A minimum of 12 months data is required for the calculation.
^ Inception date is 26/05/2017. Since inception figures are calculated on a p.a. basis. Past performance is not an indicator of future performance.
Click here to read the full performance report of the Wheelhouse Global Income Fund.
Wheelhouse Australian Enhanced Income Fund
11.0%
Income since inception p.a.
7.2%
Total return since inception p.a.
| 1 month | 3 months | 6 months | 1 year | Since inception^ | |
| Income* | 1.1% | 1.5% | 4.7% | 10.9% | 11.0% |
| Growth | 0.9% | 0.3% | 0.3% | 5.1% | (3.8%) |
| Total Return | 2.1% | 1.8% | 5.0% | 16.0% | 7.2% |
| Benchmark** | 1.8% | 1.2% | 5.3% | 16.6% | 8.4% |
| Excess return | 0.3% | 0.6% | (0.2%) | (0.6%) | (1.2%) |
Performance figures are net of fees and expenses.
* Income includes cash distributions and the value of franking credits and special dividends. Cash distributions are paid quarterly.
** Benchmark is the S&P/ASX 200 Franking Credit Adjusted Daily Total Return Index (Tax-Exempt).
^ Inception date is 9/03/2021. Since inception figures are calculated on a p.a. basis. Past performance is not an indicator of future performance.
Click here to read the full performance report of the Wheelhouse Australian Enhanced Income Fund.

