- July 22, 2022
Does a 5% dividend yield make the market a buy?
With a roller-coaster start to the year (okay we’ve just seen the down bit), investors may well see an opportunity in local, home grown, Australian dividends.
The cash dividend yield on the S&P/ASX200 Index is currently touching 5.0%, which if history is any guide, ranks the current market in the top 10% in terms of dividend yield. With yields rarely more attractive (and this is the cash yield, so add another 1.4% for franking), this has historically been a reasonable indicator that there is value appearing in the local market.
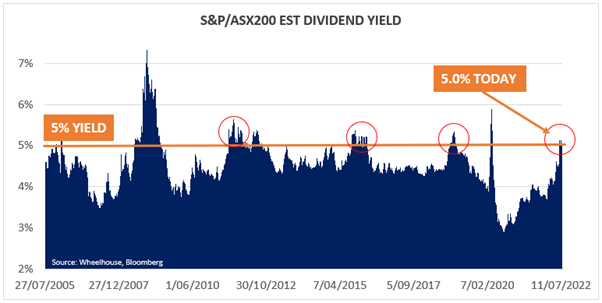
Of course, dividend yield shouldn’t be the only yardstick used to determine if there is value in the current market pricing. And even on dividend yield, a 5% dividend yield does not mean there is a floor under the current market. It should be remembered that a move to 5.5% yield (which happened often enough in the above chart) implies a further market fall of 10%.
It should also be put in context that as the GFC period indicates, a 5% yield offered little defence during a major global financial crisis. Therein lies the risks in equity investing, although we would argue that the capitalisation of the financial sector is vastly superior to where it was in 2007, and the risk of a systemic global financial crisis appears far lower. Bears may beg to differ but this slowdown looks to us far more cyclical in nature, as opposed to structural, which means we believe the banks will grapple more with growing earnings than with their own survival.
In any case, and assuming we’re not entering a doomsday scenario, dividends over time have proven to be far more resilient than earnings during a downturn. Most companies implement a ‘progressive dividend policy’, which means they aim to grow dividend payments from year to year even if earnings sometimes fall. Companies are generally loathe to cut their dividend unless absolutely necessary due to the negative signal this sends the market on longer term earnings and profit potential.
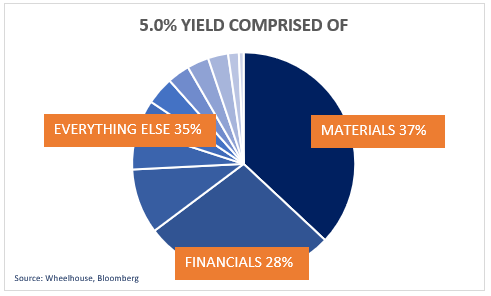
Despite this, one risk to current dividend payouts is the outsized contribution from the materials sector. The chart below allocates the dollar components of the 5.0% yield into the underlying sector that is generating it. Mining and materials are generating a very large component at 37% of the total market yield, despite accounting for only 22% of market capitalisation.
This presents risks.
In 2016 both RIO and BHP announced a change to their dividend policies, where they moved away from a ‘progressive’ policy and declared their dividends would be more closely tied to underlying earnings. This makes sense given the underlying cyclicality of commodity pricing, but it does mean that dividends are more likely to decrease with earnings, versus most other companies that have a ‘progressive’ policy and try to grow dividends every year.
This hasn’t been a problem in recent years as iron ore prices have consistently grown and as a result dividend payouts for the miners have grown alongside. However, the recent comments this week from both RIO and BHP should introduce caution in terms of extrapolating future dividends. Indeed, market estimates appear to be factoring in a near 25% cut to BHP’s dividend in the year after next (FY2024).
Assuming the entire sector faces similar challenges, a 25% cut to the yield from the materials sector would decrease the market yield to around 4.6% next year (assuming some growth in the other sectors) and take the yield much closer to historic average of 4.3% for the broader market.
As a result, while the headline yield may be screening OPPORTUNITY, we believe a more measured approach may be warranted. To us it looks like the market screens a lot closer to fairly valued on a dividend yield basis. Despite this, ‘fairly valued’ doesn’t mean the local market is not an attractive place to put money to work. Even should mining dividends be reduced, the broader income opportunity looks to be comfortably over 6% once franking is included.
In a lower growth environment, which seems likely, a safe and stable gross yield of over 6% may well prove to be an exceptionally valuable source of return relative to most anything else.
Wheelhouse Global Equity Income Fund
7.6%
Income over 5 years (p.a.)
6.4%
Income over 5 years (p.a.)
| 1 month | 1 year | 3 years (p.a.) | Since inception^ | |
| Income | 2.14% | 6.98% | 7.42% | 7.52% |
| Growth | (3.35% | 1.64% | 1.08% | 1.01% |
| Total Return | 2.35% | 10.39% | 9.05% | 8.36% |
| Benchmark* | 3.70% | 26.81% | 18.19% | 14.59% |
| Risk (Beta)** | n/a | 0.76 | 0.45 | 0.60 |
Performance figures are net of fees and expenses.
* Benchmark is the MSCI World Index (ex-Australia).
** Risk is defined as Beta and sourced from Morningstar Direct. Beta is represented vs the Benchmark and vs the S&P/ASX 200 Index. A Beta of 1.00 represents equivalent market risk to the comparison Index. A minimum of 12 months data is required for the calculation.
^ Inception date is 26/05/2017. Since inception figures are calculated on a p.a. basis. Past performance is not an indicator of future performance.
Click here to read the full performance report of the Wheelhouse Global Equity Income Fund.
Wheelhouse Australian Enhanced Income Fund
7.6%
Income since inception (p.a.)
6.4%
Total return since inception (p.a.)
| 1 month | 3 months | 6 months | Since inception^ | |
| Income* | 0.30% | 1.92% | 5.88% | 6.62% |
| Growth | (0.06%) | (2.75%) | (0.01%) | 6.34% |
| Total Return | (0.24%) | (0.83%) | 5.87% | 12.96% |
| Benchmark** | (0.40%) | 2.01% | 4.08% | 10.80% |
| Excess return | 0.64% | 1.18% | 1.79% | 2.16% |
Performance figures are net of fees and expenses.
* Income includes cash distributions and the value of franking credits and special dividends. Cash distributions are paid quarterly.
** Benchmark is the S&P/ASX 200 Franking Credit Adjusted Daily Total Return Index (Tax-Exempt).
^ Inception date is 9/03/2021. Since inception figures are calculated on a p.a. basis. Past performance is not an indicator of future performance.
Click here to read the full performance report of the Wheelhouse Australian Enhanced Income Fund.
Article: 2020 vs 2022 - Two very different bears

It goes without saying that protective strategies need to work in bear markets – but a review of three traditionally defensive strategies during the past two major drawdowns shows very mixed results. Depending upon the market conditions, some strategies worked and some failed.
In this article we review different defensive strategies and highlight the importance of diversification cross defensive strategies to deliver reliable and predictable capital preservation.
Please click here to read the article.