- March 14, 2023
Balance sheets matter
The collapse of specialised US lender Silicon Valley Bank (SVB) last week has exploded onto newswires in recent days. Banks remain one of the cornerstones of our capitalistic society, so it should come as no surprise the events have generated so much market concern.
Unfortunately for banks, they are also some of the most leveraged business models available, which can make them highly risky as an investment. Events at SVB have been well documented elsewhere, but it appears there have been some clear failures of risk management internally.
Financial strength – whether for a bank or an industrial company – can often be overlooked when economic conditions are benign. The Index below highlights this point clearly and plots the relative performance of US companies with strong balance sheets versus their corresponding market.
If history is anything to go by, a 25% fall in the S&P500 would typically send markets into a tail-spin pushing the Fear Index to a level nearer 50 or higher. Not the subdued low 30s level we see today. Panic just isn’t present in equity markets today, despite the pain being felt with markets retreating.
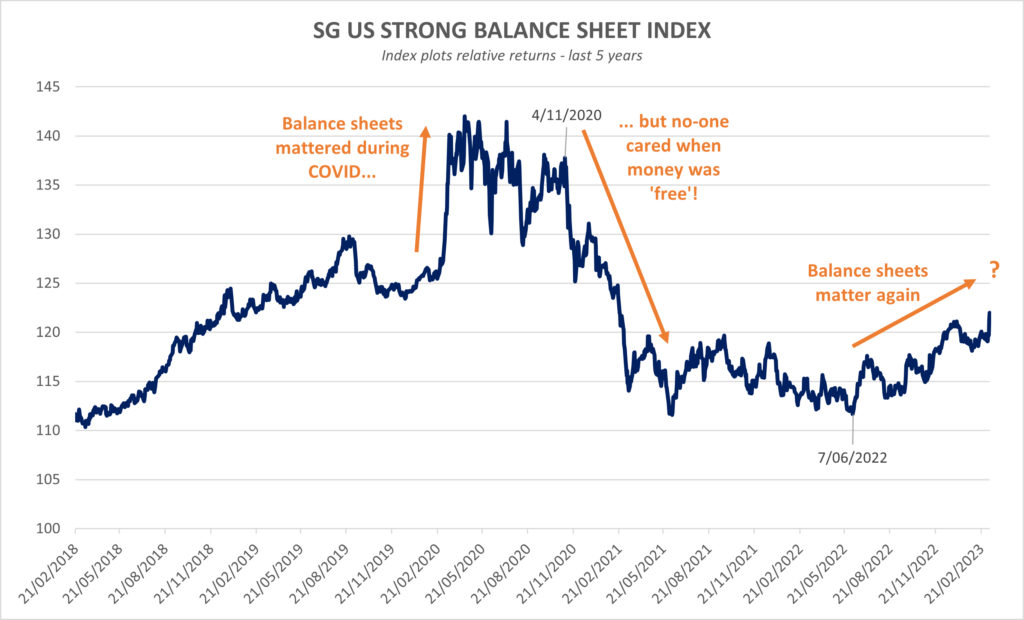
Particularly post-pandemic when the world was flush with liquidity, strong balance sheets were clearly not required. Money was free! However, the current environment seems increasingly like a period when balance sheets will matter again.
Last month we flagged the correlation between tightening loan standards in the US and the historical correlation with increased unemployment. Since then we’ve seen similar charts which highlight the impact of tighter loan standards on slowing economic growth and earnings downgrades. One question after this week might be… are loan officers more or less likely to hoard cash and further tighten lending standards?
One thing seems clear – when capital becomes harder to find, a strong balance sheet becomes increasingly valuable.
Strong balance sheets a core ingredient for Quality
Investors in our Global fund would know we rely on a Quality-biased Index to provide the underlying equity exposures. While there are different interpretations of ‘Quality’, balance sheet strength is generally regarded as a non-negotiable. Other characteristics such as high profitability (high ROE) and high levels of earnings stability also feature prominently. When combined with our income generative overlay and tail protection, the combination seems well suited for more market turmoil ahead.
While our Australian fund owns a fully diversified S&P/ASX 200 Index exposure, the strategy is designed to capture different characteristics (such as the potential for up to 2x the dividends and franking credits of the market), without having an outsized exposure to any one sector, such as financials. We believe these characteristics may add value in a slower growth environment.
Wheelhouse Global Equity Income Fund
8.0%
Income over 5 years (p.a.)
7.0%
Total return 5 years (p.a.)
| 1 month | 1 year | 1 year | 3 years (p.a.) | Since inception^ | |
| Income | 0.0% | 7.9% | 7.8% | 8.0% | 7.4% |
| Growth | 0.8% | (4.0%) | (3.8%) | (1.0%) | (0.8%) |
| Total Return | 0.8% | 3.9% | 4.0% | 7.0% | 6.6% |
| Benchmark* | 2.1% | (0.5%) | 8.3% | 10.1% | 10.0% |
| Risk (Beta)** | nm | 0.4 | 0.4 | 0.5 | 0.6 |
Performance figures are net of fees and expenses.
* Benchmark is the MSCI World Index (ex-Australia).
** Risk is defined as Beta and sourced from Morningstar Direct. Beta is represented vs the Benchmark and vs the S&P/ASX 200 Index. A Beta of 1.00 represents equivalent market risk to the comparison Index. A minimum of 12 months data is required for the calculation.
^ Inception date is 26/05/2017. Since inception figures are calculated on a p.a. basis. Past performance is not an indicator of future performance.
Click here to read the full performance report of the Wheelhouse Global Equity Income Fund.
Wheelhouse Australian Enhanced Income Fund
10.6%
Income since inception p.a.
7.5%
Total return since inception p.a.
| 1 month | 3 months | 6 months | 1 year | Since inception^ | |
| Income* | 0.3% | 1.4% | 5.3% | 11.7% | 10.6% |
| Growth | (2.1%) | (1.1%) | 0.6% | (7.4%) | (3.1%) |
| Total Return | (1.8%) | 0.3% | 5.9% | 4.3% | 7.5% |
| Benchmark** | (2.3%) | 0.5% | 7.3% | 8.6% | 9.1% |
| Excess return | 0.5% | (0.2%) | (1.4%) | (4.3%) | (1.6%) |
Performance figures are net of fees and expenses.
* Income includes cash distributions and the value of franking credits and special dividends. Cash distributions are paid quarterly.
** Benchmark is the S&P/ASX 200 Franking Credit Adjusted Daily Total Return Index (Tax-Exempt).
^ Inception date is 9/03/2021. Since inception figures are calculated on a p.a. basis. Past performance is not an indicator of future performance.
Click here to read the full performance report of the Wheelhouse Australian Enhanced Income Fund.