- February 17, 2023
The dogs are running
For contrarian investors who stepped up to buy last year’s losers, the dogs of 2022 have made a great start to 2023. The chart below plots the returns on the S&P500 by sector for the two periods. The relative returns are similar for the ASX200.
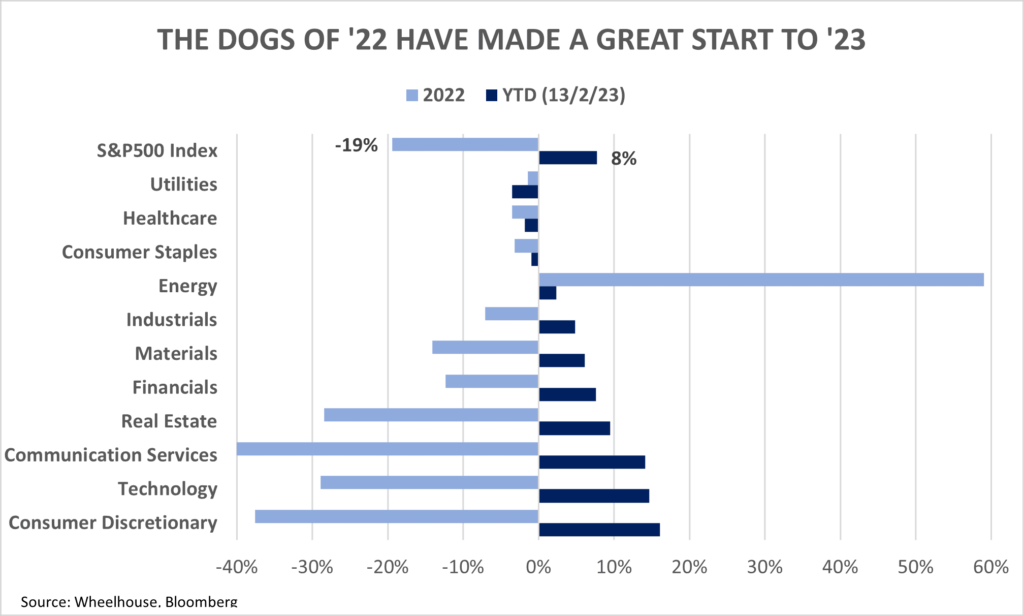
What may also be evident from the sector returns is that the powerful Value/Growth pendulum has swung again, improving 12-month returns for many Growth managers and shaving returns for many Value investors. During interest rate regime changes, returns from these powerful factors are more volatile so perhaps be prepared for more swings and roundabouts ahead.
Can the dogs keep running?
The spark for the turnaround is clearly the softening inflation prints in the US during January and the accompanying sense of an interest rate pause/pivot by the Federal Reserve. Despite a broadly more sanguine outlook for peak rates, there seems a lot already in the price at these levels.
PE multiples for the S&P 500 have risen back to 18.5x forward earnings, the highest in nearly 9 months. Even if we were to assume that inflation falls from 6.4% to 3.5% by the end of 2024 (this is the Fed dot point expectation), the historical relationship suggests that the PE multiple should be closer to 16x. At best this implies that we’re a little ahead of our skis here from a valuation perspective, although even that assumes that earnings stabilise at these levels.
US employment
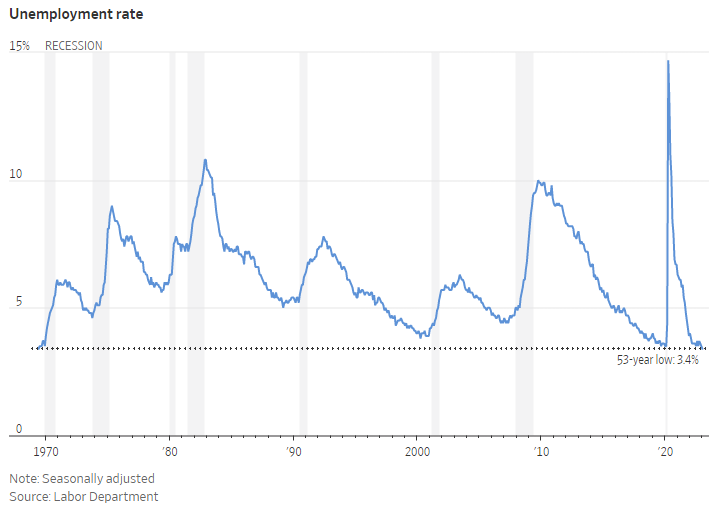
One reason equity markets have continued to run in recent weeks is the emergence of a ‘No Landing’ economic scenario, where robust economic growth co-exists with elevated inflation and a ‘higher for longer’ interest rate profile. Strong job growth has reinforced this idea, with recent hiring data helping to push the unemployment rate to a 50-year low. If everyone who wants a job can have one, is this enough to stave off recession?
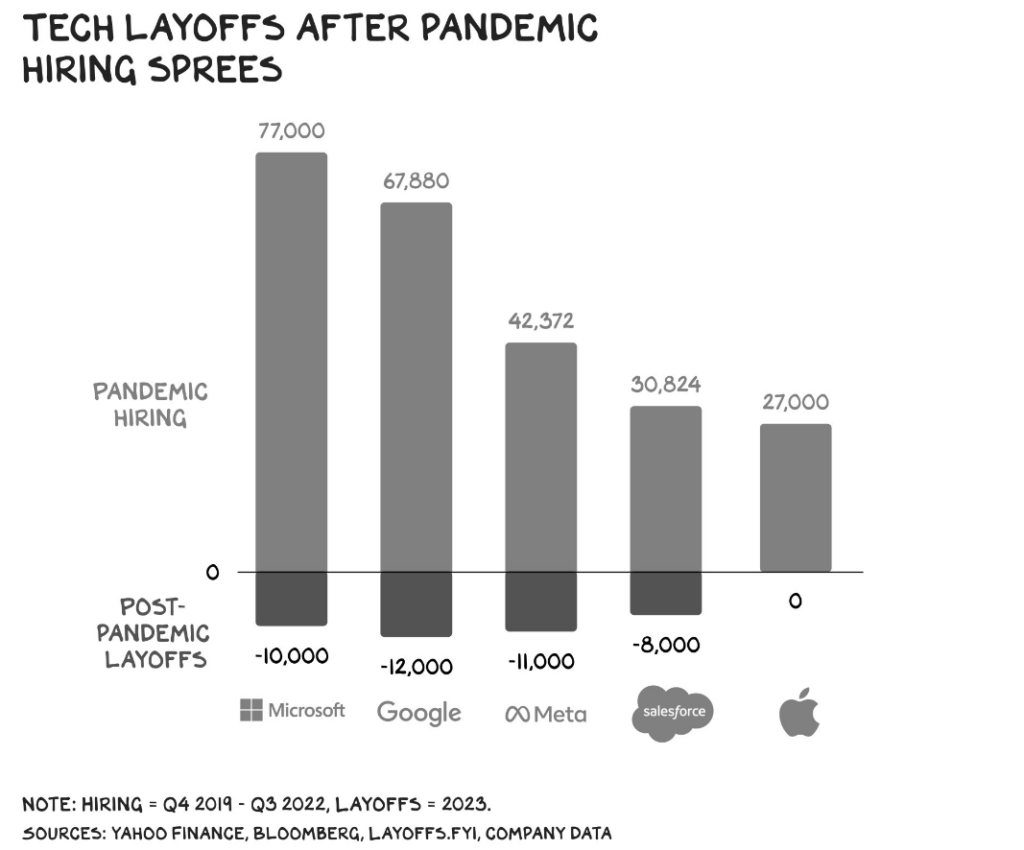
Strengthening employment seems in direct contrast to the many high-profile technology companies which have announced major layoffs in recent months. However, it’s worth noting that the technology sector is a tiny employer in terms of headcount, accounting for only around 2% of total workers. It’s also worthwhile putting the tech layoffs in contrast to the massive hiring sprees that occurred during and immediately post the pandemic.
The real engine room of labour market growth has been in the services sector. As the economy has reopened and transitioned from demand for goods to demand for services, the services sector has delivered nearly 2/3rds of all job growth over the past 3 months.
This job creation has been focused on the more labour-intensive industries like healthcare, restaurants and child-care, which all bore the brunt of the downturn caused by pandemic.
This rebalancing seems to us to be the real driver of the strong labour market, and we’d be careful to infer that the labour market recovery is more reflective of strong underlying economic growth (especially when nearly all other economic indicators are suggesting contraction).
In other words, the jobs recovery seems to us to be a head fake, as it relates to a post pandemic rebalance and not to a fundamental reboot based on strong economic fundamentals.
A negative signal for jobs, and thus for growth
Chart of the month comes from ASR and plots the relationship between tightening loan standards by US banks, and US unemployment.
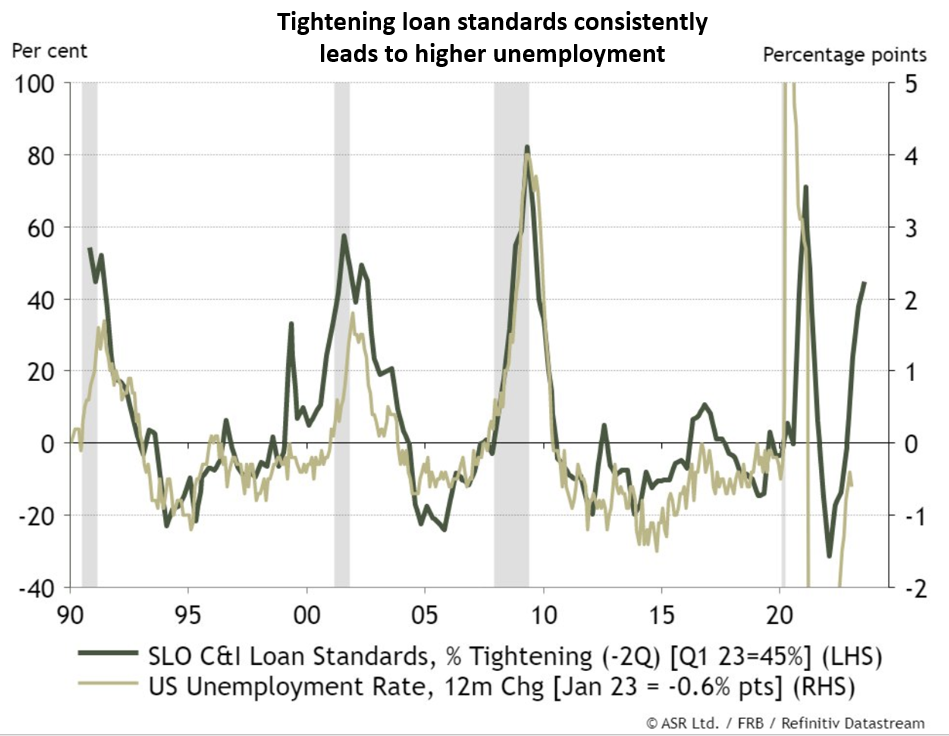
Historically this relationship makes intuitive sense. Tighter loan standards make it harder for businesses to fund the hiring and retention of workers. With the sharp pick up in loan standards it would seem that a reasonable pick up in unemployment awaits, along with increasing odds of a hard landing scenario. We believe this would pretty quickly harpoon the ‘No Landing’ thesis.
Conclusion
It’s worth noting that in recent weeks the equity and bond markets have started diverging, which is a different trend to most of 2022 when higher interest rates caused both asset classes to fall alongside one another. Should cracks start to appear in the labour market and wage-driven inflation prove a little sticker to contain than supply-chain inflation, equities may soon follow bonds down. Stagflation does not seem priced at 18.5x PE.
Wheelhouse Global Equity Income Fund
8.0%
Income over 5 years (p.a.)
7.0%
Total return 5 years (p.a.)
| 1 month | 1 year | 1 year | 3 years (p.a.) | Since inception^ | |
| Income | 0.0% | 7.6% | 7.7% | 8.0% | 7.5% |
| Growth | 1.2% | (8.6%) | (4.7%) | (1.0%) | (0.9%) |
| Total Return | 1.2% | (1.0%) | 3.0% | 7.0% | 6.6% |
| RBA +2.5% | 0.4% | 4.1% | 3.2% | 3.4% | 3.5% |
| Benchmark* | 3.0% | (7.9%) | 5.8% | 9.5% | 9.7% |
| Market Risk** | nm | 0.5 | 0.4 | 0.5 | 0.6 |
Performance figures are net of fees and expenses.
* Benchmark is the MSCI World Index (ex-Australia).
** Market Risk is defined as Beta and sourced from Morningstar Direct. A Beta of 1.00 represents equivalent marketrisk to the Benchmark. A minimum of 12 months data is required for the calculation.
^ Inception date is 26/05/2017. Since inception figures are calculated on a p.a. basis. Past performance is not an indicator of future performance.
Click here to read the full performance report of the Wheelhouse Global Equity Income Fund.
Wheelhouse Australian Enhanced Income Fund
11.0%
Income since inception p.a.
8.8%
Total return since inception p.a.
| 1 month | 3 months | 6 months | 1 year | Since inception^ | |
| Income* | 0.0% | 1.5% | 5.6% | 13.8% | 11.00% |
| Growth | 5.0% | 6.3% | 4.2% | (3.2%) | (2.2%) |
| Total Return | (5.0%) | 7.8% | 9.8% | 10.6% | 8.8% |
| Benchmark** | 6.2% | 9.8% | 11.3% | 14.0% | 10.8% |
| Excess return | (1.2%) | (2.0%) | (1.5%) | (3.4%) | (2.0%) |
Performance figures are net of fees and expenses.
* Income includes cash distributions and the value of franking credits and special dividends. Cash distributions are paid quarterly.
** Benchmark is the S&P/ASX 200 Franking Credit Adjusted Daily Total Return Index (Tax-Exempt).
^ Inception date is 9/03/2021. Since inception figures are calculated on a p.a. basis. Past performance is not an indicator of future performance.
Click here to read the full performance report of the Wheelhouse Australian Enhanced Income Fund.