- April 14, 2022
Energy - the mouse that roared
For a ‘risk-off’ environment, returns from many traditionally defensive asset classes were left wanting this quarter. The interplay between geopolitical risk, globally diversified supply lines, and the resultant impact on inflation and interest rate expectations has clearly upended recent investment returns for many of the different asset classes illustrated below.
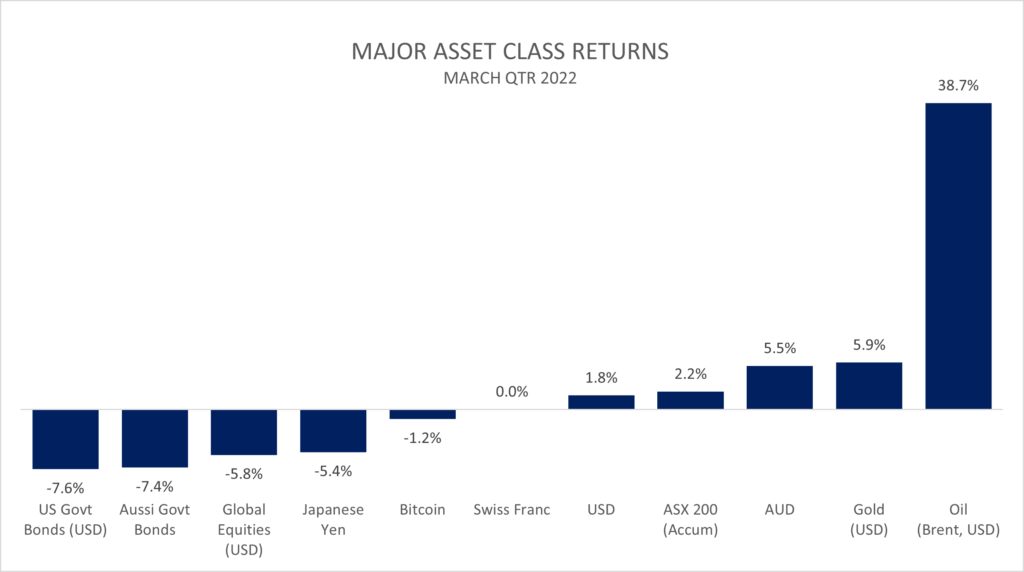
The rally in energy was truly breathtaking during the quarter, highlighting the fragility of reliable energy sources that we often take for granted. Unfortunately for investors, the energy sector accounts for only 4% of global sharemarket indices so had a difficult job moving broader indices higher on its own.
While the energy sector is small from a market capitalisation perspective, the spike in oil prices has far wider ramifications for the economy and thus for all asset classes. The outperformance of commodity related currencies (AUD vs JPY) and markets (ASX 200), plus movement in interest rates and government bonds, helps explain the unusual moves in what are considered traditionally defensive assets.
Evidence of this dramatic change in outlook can be observed in how traders have changed their oil price expectations in future years. The chart below illustrates the most recent forward curve for Brent oil (the orange line), and how it has changed from 6 months ago (pre Ukrainian crisis, green line) and 5 years ago (blue line).
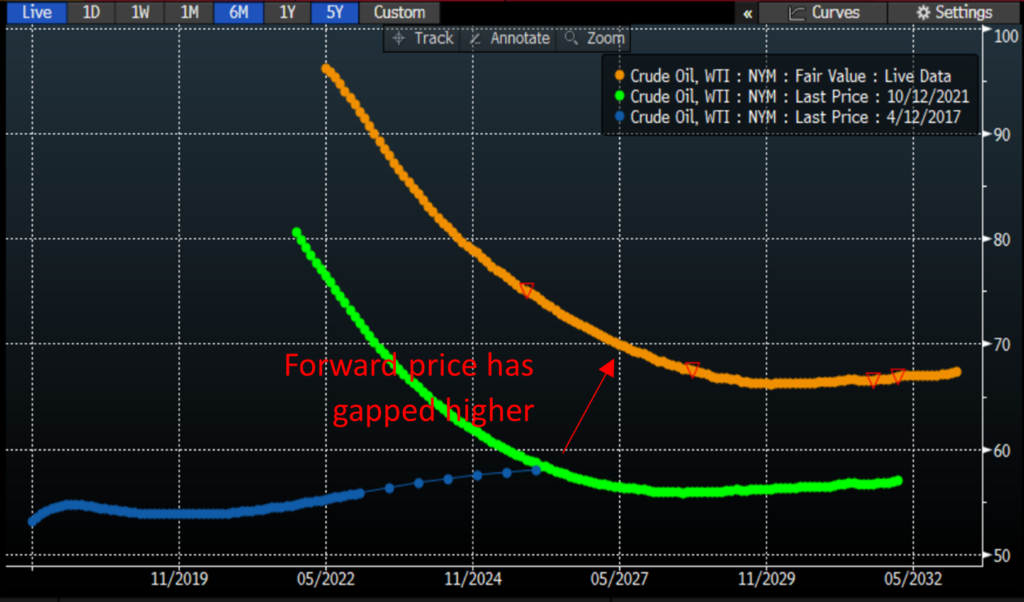
The current Brent oil future is showing oil being priced for delivery at around $70/bbl in 5-years, up from around $57 only 6 months ago. This is a similar price to that expected 5 years ago (the blue line).
Interestingly, the oil market (as with most other commodities) is currently in backwardation, meaning forward prices are expected to be lower than current spot prices. Usually when backwardation is as acutely steep as the current curve it can suggest that the market believes geopolitical and supply side issues will be resolved shortly, and prices will fall. This may prove true in coming months. The fact that longer-term expectations are materially higher also signals that expectations have broadly changed for longer term energy prices which in turn will likely keep inflation supported.
This change in expectations for inflation and markets is also evident in other signposts. Inflation breakevens have steadily climbed the past two months, which is helping to push the short end of the yield curve to inversion. As has been well covered elsewhere, an inverted yield curve is often a harbinger for impending recession and it seems clear that albeit still a low probability in the short-term, this risk is far more elevated than it was only three months prior.
All up, since the failure of brinkmanship in Ukraine, we feel that the sense of change in the market is palpable. Regardless of whether we have a recession this year or next, the ingredients for slower growth in both economies and markets appear to be evident. Income will almost certainly prove an increasingly important source of real return should this scenario materialise.
Wheelhouse Global Equity Income Fund
7.9%
Income over 3 years (p.a.)
5.2%
Total return over 3 years (p.a.)
| 1 month | 1 year | 3 years (p.a.) | Since inception^ | |
| Income | 1.81% | 7.91% | 7.90% | 7.47% |
| Growth | (5.35%) | (6.20%) | (2.66%) | (1.23%) |
| Total Return | (3.54%) | 1.71% | 5.25% | 6.24% |
| Benchmark* | (0.89%) | 11.60% | 12.93% | 11.87% |
| Risk (Beta)** | n/a | 0.63 | 0.47 | 0.60 |
Performance figures are net of fees and expenses.
* Benchmark is the MSCI World Index (ex-Australia).
** Risk is defined as Beta and sourced from Morningstar Direct. Beta is represented vs the Benchmark and vs the S&P/ASX 200 Index. A Beta of 1.00 represents equivalent market risk to the comparison Index. A minimum of 12 months data is required for the calculation.
^ Inception date is 26/05/2017. Since inception figures are calculated on a p.a. basis. Past performance is not an indicator of future performance.
Global fund commentary
The Global fund suffered from uncharacteristic strength in the Australian dollar during what was a weaker quarter for equity markets. The currency impact on returns for February and March combined was negative 6.1% versus the total drawdown of 7.4% for the Fund over the same period. While painful, we don’t believe the Australian dollar has lost its underlying defensive characteristics for either a slowing growth environment, or for a more acute geopolitical event in our region, both of which would affect the Australian economy (and investors) more directly. Rather, we see the recent AUD strength as a short-lived reaction to the spike in commodity prices which already appears to be waning.
Leaving currency aside, the defensive benefits of the Fund were clearly evident during the lows in early March with the fund only falling a little over half the equity market decline from peak to trough in USD (the trough so far, that is).
Given the exceptional rebound into month-end which saw cyclicals solidly outperform there was some underperformance in the equity portfolio. We should highlight that for the past 12 months the equity portfolio has trailed the benchmark by 3.7%, as quality has in general lagged more cyclical exposures, including energy. Similar to currency, we remain comfortable that quality businesses with pricing power (or Wide Moat, in Morningstar language) will serve us well as we transition to a lower-growth investing climate with higher inflation and volatility.
Looking forward, we believe there is an increasing opportunity for the underlying income generation of the fund to prove its worth in a lower growth world. Combined with a portfolio of high-quality equities, we believe this differentiated approach will serve us well in fully funding our income objectives of 7-8% annually, even if broader equity returns are lower.
Click here to read the full performance report of the Wheelhouse Global Equity Income Fund.
Wheelhouse Australian Enhanced Income Fund
7.9%
Income since inception (p.a.)
5.2%
Total return since inception (p.a.)
| 1 month | 3 months | 12 months | Since inception^ | |
| Income* | 1.87% | 3.51% | 11.72% | 11.04% |
| Growth | 5.29% | (1.61%) | 6.35% | 6.26% |
| Total Return | 7.17% | 1.91% | 18.07% | 17.29% |
| Benchmark** | 7.05% | 2.81% | 16.62% | 16.02% |
| Excess return | 0.12% | (0.90%) | 1.45% | 1.27% |
Performance figures are net of fees and expenses.
* Income includes cash distributions and the value of franking credits and special dividends. Cash distributions are paid quarterly.
** Benchmark is the S&P/ASX 200 Franking Credit Adjusted Daily Total Return Index (Tax-Exempt).
^ Inception date is 9/03/2021. Since inception figures are calculated on a p.a. basis. Past performance is not an indicator of future performance.
Australian fund commentary
The Australian fund celebrated its first birthday this month and is close to meeting all our targeted objectives.
- Outperformance – Total return was 18.1% for the year which made for 1.5% outperformance after fees.
- Twice the yield of the market – Total income was 11.7%, or close to double the fully-franked dividend yield of the Australian market.
- Tracking error was amongst lowest of peer group at 2.5%, with zero value or growth tilts.
With the 12-month hurdle behind us and key objectives being met, we are pleased the Fund returns are coming together as expected.
Click here to read the full performance report of the Wheelhouse Australian Enhanced Income Fund.