- October 14, 2022
The bear with no bite... why the VIX is not 50
While it may not feel like it, the market drawdown this year has been relatively calm and orderly, at least so far as the foremost equity ‘fear gauge’ is concerned – the VIX index.
The VIX Index measures the S&P500 equity market volatility and is commonly used by investors to measure market sentiment. As shares are typically much more volatile when markets are falling, spikes in the VIX coincide with periods of acute market fear. Hence the moniker ‘Fear Index’.
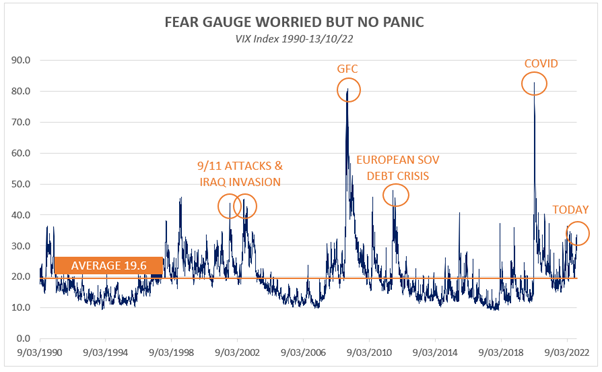
If history is anything to go by, a 25% fall in the S&P500 would typically send markets into a tail-spin pushing the Fear Index to a level nearer 50 or higher. Not the subdued low 30s level we see today. Panic just isn’t present in equity markets today, despite the pain being felt with markets retreating.
Why no panic?
The lack of fear is largely attributable to the speed of the sell-off, or rather the lack of it. Compared to Q1 2020 when the market plummeted more than 30% in a matter of weeks, the present drawdown has persisted for more than 9 months and it’s not clear if we have found the bottom yet.
Additionally, we must consider the primary catalyst for this move – interest rate hikes and a tightening of financial conditions – which was forecast by economists and forewarned by central bankers well in advance of the current rate hiking cycle (even if the latter got the magnitude a smidge wrong!).
Thus far we have witnessed little risk to the structural financial stability of financial institutions or Governments (although the UK appears intent to prove otherwise). As markets have digested the steadily increasing inflation prints and the resultant steadily increasing interest rates, there has been ample time to reposition portfolios to be more defensive.
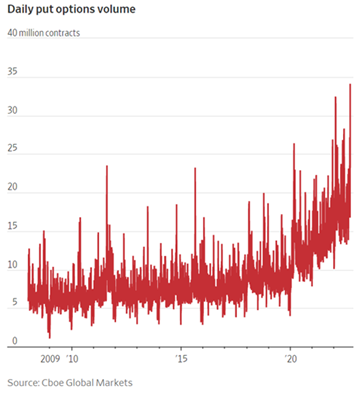
Various broker surveys show investor positioning turning far more defensive over the course of the year, with hedge funds deleveraging and portfolio managers holding more cash. Additionally, purchases of protective put options have been steadily rising since Q1 2020 which implies investors are far better shielded from market falls than they have been historically.
When the defensive positioning is considered, it makes sense that levels of panic in the market are far less than where they could or should be, had investors been completely unprepared for the current market rout.
What is happening in Fixed Income markets?
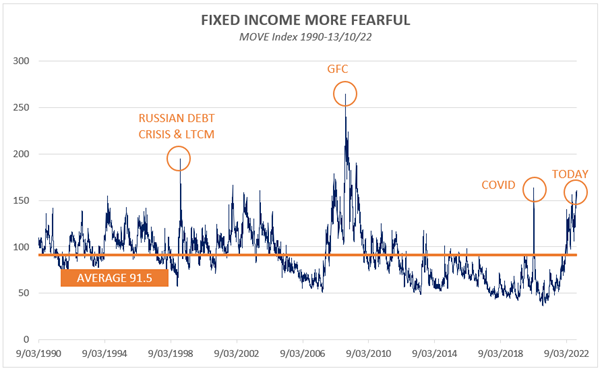
Panic is more apparent in other asset classes and fixed income is a good example. The MOVE Index is an equivalent measure of the volatility in the US fixed income market. Current levels are extreme given the massive move in US yields and the uncertainty surrounding the direction and magnitude of future rates movements.
UK gilts are a good example of the panic emerging in some corners of the Fixed Income market. Year to date 30-year Gilts have fallen more than 50% as part of the UK pension crisis, an extreme drawdown for what is usually considered a defensive asset. This risk is worth keeping an eye on should contagion spread into other markets or asset classes, for example if it affected the credit worthiness or orderly functioning of a major financial institution or marketplace.
Where to from here?
From our perspective the flow of economic bad news seems likely to continue. Economic markers in the US continue to highlight a slowing economy, with earnings downgrades very likely to result as we move into the 3Q reporting season.
Furthermore, the continued high inflation readings combined with low unemployment, means there is essentially no handbrake on Fed hawkishness and their propensity to continue hiking rates.
However, slowing earnings and tighter financial conditions have been well telegraphed and are hardly a non-consensual view in the current market. It seems to us that everyone is bearish, it’s just a question of how much! As the lack of panic in equity markets has highlighted, investors already seem well positioned for more bad news.
Short of any financial system breakages (eg, UK contagion spreading), this time around we simply might not receive a signal via a pop in the VIX of investor capitulation, which many in the market might be waiting for.
With everyone sitting on the same side of the boat (defensively positioned and expecting the storm), we may be approaching a point where it makes sense to take a more balanced approach to risk. While it’s difficult to make a case for a massive rebound rally, with investors already universally bearish we may be close to a good entry point for acceptable (albeit more modest) returns in coming years.
Wheelhouse Global Equity Income Fund
7.8%
Income over 5 years (p.a.)
6.3%
Total return 5 years (p.a.)
| 1 month | 1 year | 1 year | 3 years (p.a.) | Since inception^ | |
| Income | 1.96% | 7.00% | 7.48% | 7.78% | 7.52% |
| Growth | (2.23%) | (13.61%) | (5.18%) | (1.48%) | (1.95%) |
| Total Return | (0.28%) | (6.61%) | 2.30% | 6.30% | 5.57% |
| Benchmark* | (3.23%) | (9.79%) | 6.33% | 9.65% | 8.97% |
| Risk (Beta)** | nm | 0.36 | 0.42 | 0.49 | 0.59 |
Performance figures are net of fees and expenses.
* Benchmark is the MSCI World Index (ex-Australia).
** Risk is defined as Beta and sourced from Morningstar Direct. Beta is represented vs the Benchmark and vs the S&P/ASX 200 Index. A Beta of 1.00 represents equivalent market risk to the comparison Index. A minimum of 12 months data is required for the calculation.
^ Inception date is 26/05/2017. Since inception figures are calculated on a p.a. basis. Past performance is not an indicator of future performance.
Click here to read the full performance report of the Wheelhouse Global Equity Income Fund.
Wheelhouse Australian Enhanced Income Fund
11.6%
Income since inception p.a.
2.0%
Total return since inception p.a.
| 1 month | 3 months | 6 months | 1 year | Since inception^ | |
| Income* | 3.12% | 3.76% | 6.98% | 11.22% | 11.59% |
| Growth | (8.30%) | (1.81%) | (19.83%) | (19.84%) | (9.56%) |
| Total Return | (5.18%) | 1.95% | (12.85%) | (8.62%) | 2.03% |
| Benchmark** | (5.71%) | 1.09% | (10.80%) | (6.22%) | 2.81% |
| Excess return | 0.53% | 0.86% | (2.05%) | (2.40%) | (0.78%) |
Performance figures are net of fees and expenses.
* Income includes cash distributions and the value of franking credits and special dividends. Cash distributions are paid quarterly.
** Benchmark is the S&P/ASX 200 Franking Credit Adjusted Daily Total Return Index (Tax-Exempt).
^ Inception date is 9/03/2021. Since inception figures are calculated on a p.a. basis. Past performance is not an indicator of future performance.
Click here to read the full performance report of the Wheelhouse Australian Enhanced Income Fund.
News: Wheelhouse hires Head of Distribution

We are delighted to announce that Wayne McGauley has recently joined the firm in the newly created role of Head of Distribution.Wayne joins us from IML where he served as Head of Retail for 13 years and was responsible for setting and executing the IML Retail strategy.
Wayne has joined us in our Brisbane office and we’re very excited to have him on board.We’re looking forward to be out and about a lot more in 2023.
Wayne can be reached directly on wayne.mcgauley@wheelhouse-