- November 17, 2023
Without trucks Australia stops…
Highway motorists would be familiar with the truckie slogan below. For Australian investors, a similar message rings true. ‘Without dividends, the S&P/ASX200 stops.’
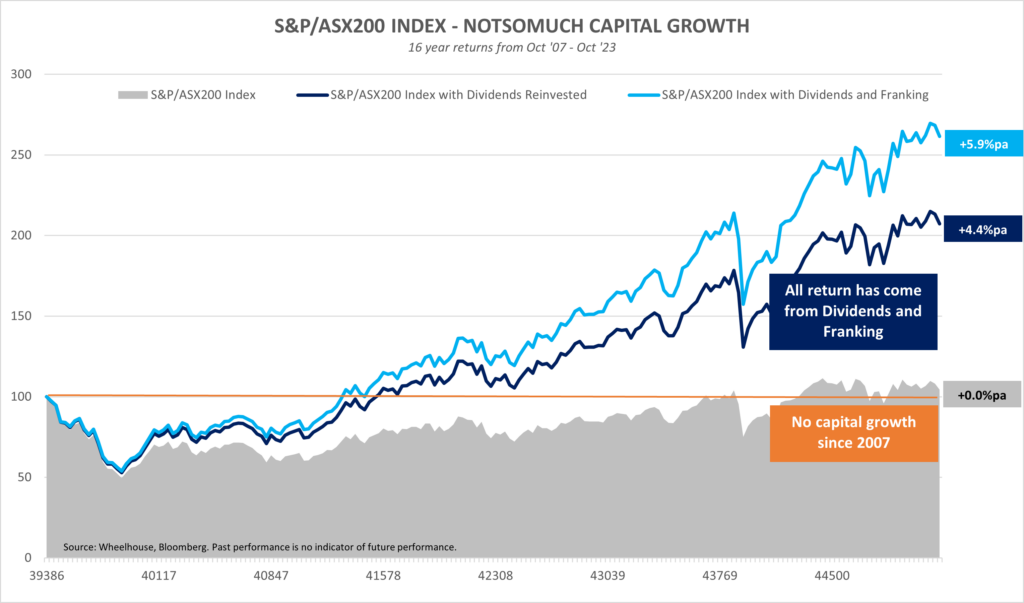
Commentators have recently pointed out that the S&P/ASX200 Index is currently little better off than it was 16 years ago, on the eve of the GFC.
Of course, this simple analysis focuses just on capital growth and neglects the impact of received dividends and franking credits. As shown in the chart below, these income generators have proven to be the real engine of total return over this period. This income-driven return profile should not come as a huge surprise – when capital growth is harder to find, income generation often delivers much of the heavy lifting.
This low growth environment is also where other income generative strategies can work, such as rules-based overlays. The Australian BuyWrite Index, presented below, has done particularly well during this period.
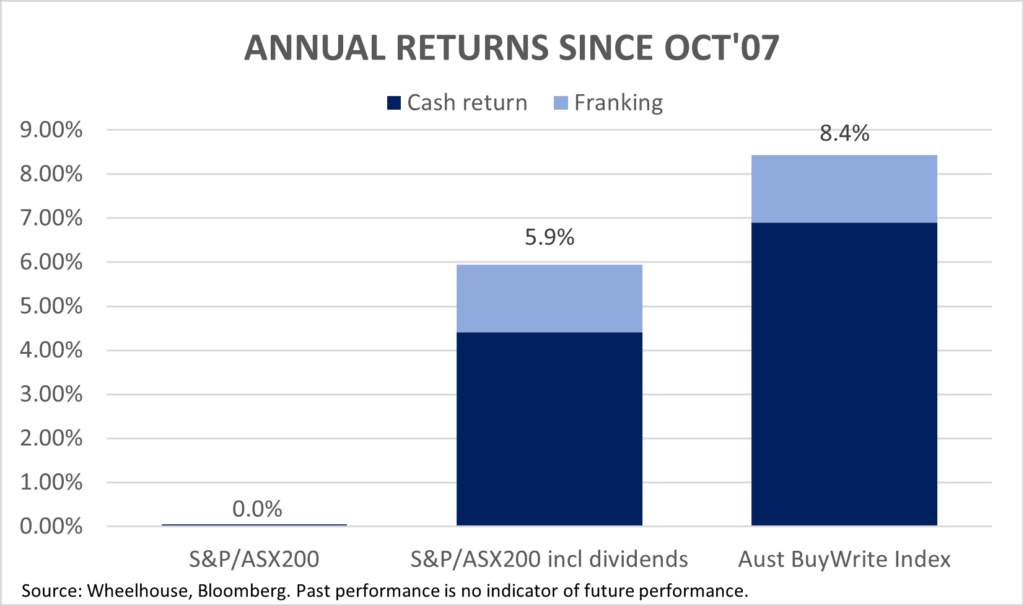
This index receives all of its return from 1) dividends received on the shares owned, plus (2) received option premium from the systematic sale of options. When these two sources of returns are combined, returns have been meaningfully enhanced. As the BuyWrite Index owns the underlying shares and enjoys the benefits of share ownership, Franking credits may also supplant the return (assuming the franking credits can always be reliably distributed).
These returns reinforce the thesis that in lower growth markets, income often proves a critical source of return.
After-tax returns
One important consideration for investors reviewing the above returns, is the assumption that Dividends and Franking credits can be reinvested back into the market with zero tax paid.
This may well be true for investors in Pension phase, Charities or Not for profits. However, for many investors the real world after tax outcome will likely be very different to those represented above. For example, a simple application of the top marginal tax rate of 47% (45% + 2% Medicare), means returns for these 2 strategies are nearly halved.
The same could be said for any income producing asset over this period, such as term deposits or private credit, where income is the primary/only source of return.
Tax efficient income investing
At Wheelhouse, we specialise in the rules-based overlays similar to the S&P/ASX200 BuyWrite Index. However, we’re also mindful of after-tax outcomes, as we believe many investors seeking an equity rate of return are likely to be in Accumulation phase, or higher tax paying environments, than those in Pension phase within super.
With this in mind, we believe the Wheelhouse Australian Enhanced Income Fund ticks the box for a broad range of investor profiles. While the regular quarterly franked income distribution that the Fund has paid has proven attractive for investors in Pension phase, we believe investors in Accumulation phase, or pre-retiree investors, may also benefit from a more efficient compounding of returns, once accounting for after-tax performance.
Please join us for a webinar (see below) to discuss after tax returns and how to maximise returns for an Australian equity allocation.
Webinar Exclusive
We’re hosting a Q&A with Alastair MacLeod and Andrew MacLeod to discuss ways to maximise your Australian Equities Allocation.
Date: 10am AEST
Time: Wednesday, 22nd of November
This webinar is only for advisers and wholesale investors.
Wheelhouse Global Fund
| 1 mo | 3 mo | 6 mo | 1 yr | 3 yrs (pa) | 5 yrs (pa) | S/I (pa) | |
| Total fund return | -1.7% | -5.9% | -5.8% | 0.0% | 3.4% | 4.7% | 5.4% |
| RBA+2.5%* | 0.6% | 1.7% | 3.4% | 6.3% | 4.1% | 3.8% | 3.9% |
| Risk (volatility) | – | – | – | 6.1% | 7.6% | 7.5% | 7.6% |
* The Fund’s benchmark is RBA +2.5% and is used for all time periods shown. From the Fund’s inception to 31 August 2023 the Fund’s benchmark was MSCI World ex Australia Index (AUD). The change in benchmark does not impact any fees the manager may earn and the Fund’s investment objective has not changed.
Performance figures are net of fees and expenses. Inception date is 26 May 2017. Past fund performance is not indicative of future performance.
Wheelhouse Australian Fund
| 1 mo | 3 mo | 6 mo | 1 yr | S/I pa^ | |
| Income* | 0.1% | 2.6% | 4.0% | 8.7% | 10.4% |
| Growth | -4.6% | -9.8% | -9.6% | -7.0% | -6.4% |
| Total Return | -4.5% | -7.2% | -5.6% | 1.7% | 4.0% |
| Benchmark** | -3.7% | -6.7% | -4.6% | 4.4% | 5.7% |
Performance figures are net of fees and expenses. Since inception numbers include 30bps exit spread.
* Income includes cash distributions and the value of franking credits and special dividends. Cash distributions are paid quarterly.
** Benchmark is the S&P/ASX 200 Franking Credit Adjusted Daily Total Return Index (Tax-Exempt).
^ Inception date is 09/03/2021. Since inception figures are calculated on a p.a. basis. Past performance is not an indicator of future performance.
For any questions or enquiries about our funds or investment strategies, please contact Wayne McGauley, Head of Distribution, via wayne.mcgauley@wheelhouse-