Dear fellow investor
“Inflation is not a problem.”
That seems to be what the bond market is saying, an important bellwether as bonds are particularly ill-disposed towards bouts of inflation. Long-dated bond yields have fallen in the US and Australia meaningfully in the past 6 weeks as the market becomes increasingly comfortable that the US Federal Reserve, and by default the RBA, is in control of the inflationary genie and that the recent elevated inflation statistics in the US are indeed ‘transitory’.
What is the downside if the market is wrong?
As always in markets we need to consider not only the frequency of tail events, but also the magnitude. The impact of sustained high inflation is indeed meaningful.
The chart below plots the valuation of the S&P 500 Index (Price/Earnings multiple) versus the trailing 12-month Consumer Price Index (CPI), a broad gauge of US inflation.
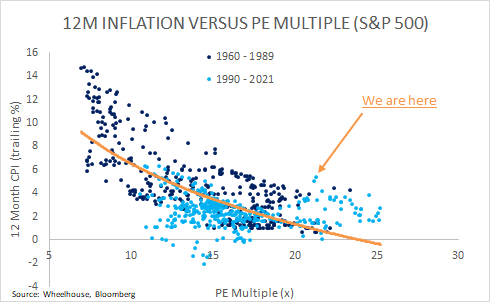
Using the latest data from June, trailing inflation was 5.4% year on year in the US, with the current market valuation at 21.5x. Clearly this reading is a long way from trend, and underscores the market’s expectation that inflation readings will fall in coming months. Should this occur, and interest rates remain suppressed, then perhaps the current market valuation of 21.5x can be rendered more acceptable (at least relative to interest rates and inflation).
From what we read and observe – and we agree – this does seem to be the most plausible outcome. Many of the inflationary forces are being driven by re-opening factors that appear concentrated in the travel and leisure markets. For example, rental car rates in the US have increased 110% since last year, which along with the surge in building material prices (lumber is up 80% in the US, less so here in Australia), is causing the inflationary indexes to pop.
Many of these price rises are clearly transitory, although supply chain bottlenecks which are particularly affecting the auto and semiconductor sectors, may take longer to digest. As the grounding of the Ever Given in the Suez Canal earlier this year proved, it’s not impossible for an exogenous shock to help keep prices rising, even if there is a moderation of growth in the broader economy. Could inflation remain high while the economy actually slows? We’ll write more on the perils of Stagflation in later reports.
Based on these learnings, we believe it is worthwhile to at least contemplate the magnitude of downside in equities were inflation pressures to persist, even if the likelihood is low. Referencing the chart above, historically a 5% inflation print is more consistent with a market valuation of less than 15x. Furthermore, inflation will usually squeeze company margins initially before businesses with genuine pricing power can respond, suggesting that earnings would likely decline too. When combined, it’s not difficult to envisage markets 30% lower if historical relationships hold.
How to protect against inflation in an equity portfolio?
Shares of high-quality companies that benefit from pricing power have historically been able to endure higher inflationary periods better than most major asset classes. We have written about large pharmaceutical exposures which fit this mould. Additionally, commodities and other real asset exposures are also likely to preserve value better than most other securities. We see no reason why these characteristics would be any different this time around.
However, it is also worth considering the relationship between inflation and market volatility and the opportunities this presents to protect investors. The chart below, from Societe Generale, illustrates how market volatility (measured by the VIX Index) has historically increased when inflation (as well as deflation) is present.
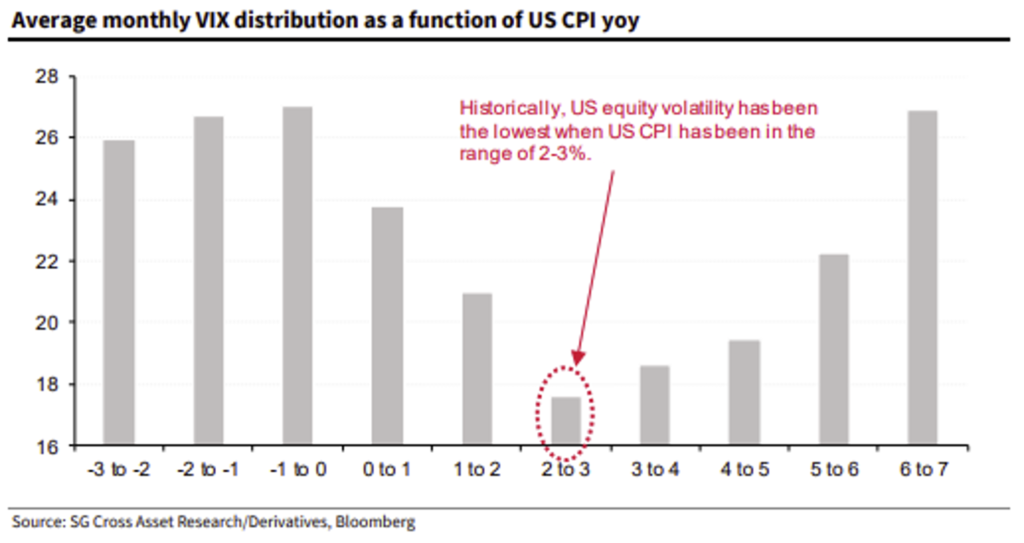
Several derivative based strategies can take advantage of this high volatility. Tail hedging can add value from sharp spikes in volatility particularly in a drawdown. Similarly, buy-write strategies (which sell options and generate income) typically perform well during periods of higher volatility and sideways/grinding markets. As such, accessing a different source of return can add value to an otherwise vanilla long-only equity portfolio that is completely reliant on the idiosyncratic characteristics of the companies it owns to preserve value.
While the cork on the inflationary genie appears to have been stoppered for now, we feel it makes sense to have a viable Plan B on hand given the magnitude of the risk were inflation to become more established.
Wheelhouse Global Equity Income Fund
7.8%
Income over 3 years (p.a.)
8.3%
Income over 3 years (p.a.)
| 1 month | 1 year | 3 years (p.a.) | Since inception^ | |
| Income | 2.79% | 8.92% | 7.81% | 7.66% |
| Growth | (0.21%) | 0.36% | 0.50% | 0.71% |
| Total Return | 2.58% | 9.28% | 8.30% | 8.37% |
| Benchmark* | 4.71% | 27.50% | 14.50% | 13.62% |
| Risk (Beta)** | n/a | 0.46 | 0.48 | 0.59 |
Performance figures are net of fees and expenses.
* Benchmark is the MSCI World Index (ex-Australia).
** Risk is defined as Beta and sourced from Morningstar Direct. Beta is represented vs the Benchmark and vs the S&P/ASX 200 Index. A Beta of 1.00 represents equivalent market risk to the comparison Index. A minimum of 12 months data is required for the calculation.
^ Inception date is 26/05/2017. Since inception figures are calculated on a p.a. basis. Past performance is not an indicator of future performance.
Click here to read the full performance report of the Wheelhouse Global Equity Income Fund.
Wheelhouse Australian Enhanced Income Fund
Performance numbers below are based on exit prices and include the 30bps exit spread.
| 1 month | 3 months | Since inception^ | |
| Income* | 3.30% | 3.83% | 3.86% |
| Growth | (1.15%) | 4.85% | 5.13% |
| Total Return | 2.15% | 8.68% | 8.99% |
| Benchmark** | 2.26% | 8.46% | 8.87% |
| Excess return | (0.11%) | 0.21% | 0.13% |
Performance figures are net of fees and expenses.
* Income includes cash distributions and the value of franking credits and special dividends. Cash distributions are paid quarterly.
** Benchmark is the S&P/ASX 200 Franking Credit Adjusted Daily Total Return Index (Tax-Exempt).
^ Inception date is 9/03/2021. Since inception figures are calculated on a p.a. basis. Past performance is not an indicator of future performance.
Click here to read the full performance report of the Wheelhouse Australian Enhanced Income Fund.