'tis the season...
Call it Christmas in July, investors have enjoyed a festive past few months with market volatility falling and share prices rising. Indeed, there appears to be some reasonable seasonality to this relationship. The chart below plots the average market volatility for the S&P500 Index (measured by the VIX Index), since 1990. While the absolute numbers this year are slightly lower than average, the trend has been very similar.
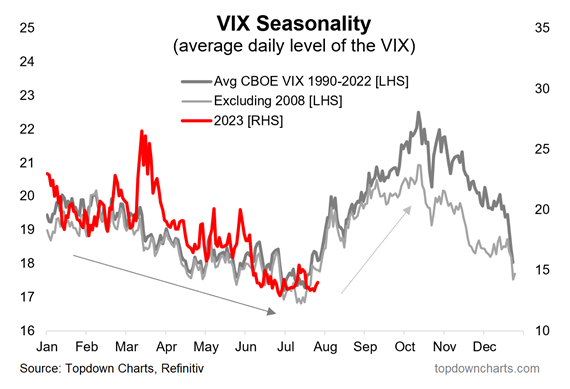
As most investors would know, rising market volatility usually always equates with falling share prices. Does this mean share prices usually fall from August to October?
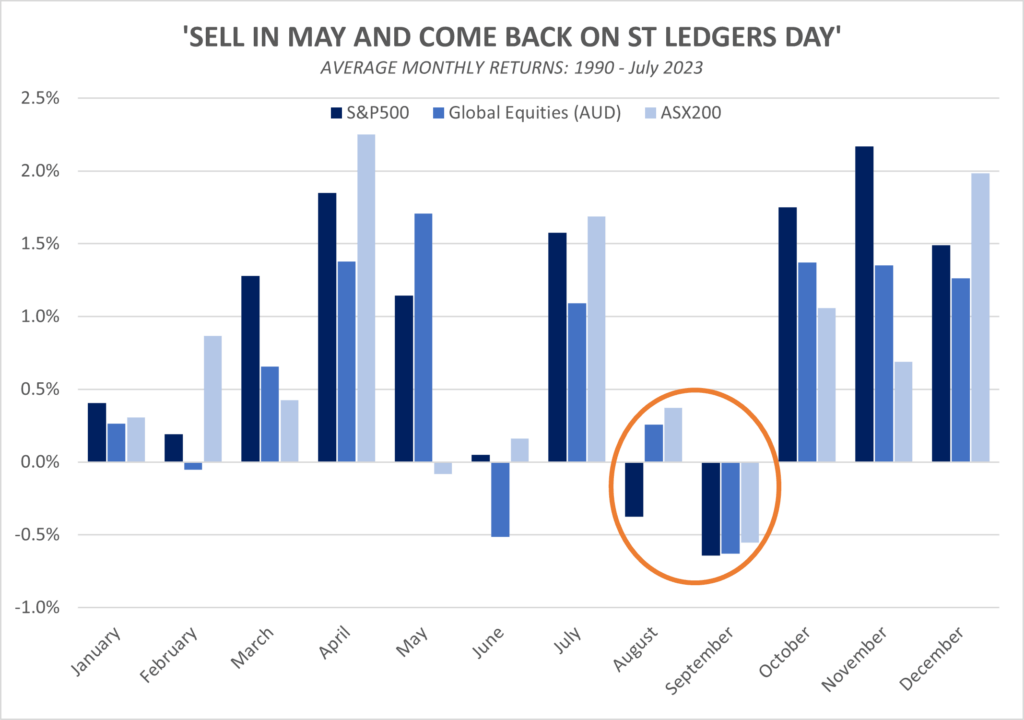
Alas, they often do. September in particular is usually a tough month, with average equity returns for major indexes generally weak in August and negative in September. The frequency of a negative month is also higher in these two months.
Will 2023 follow this historical pattern and deliver weak returns? Three quotes* perhaps worth remembering:
- There are two kinds of forecasters: those who don’t know, and those who don’t know they don’t know. (John Kenneth Galbraith)
- Risk means more things can happen than will happen (Elroy Dimson)
- We cannot predict, but we can prepare (Howard Marks)
*all three are mentioned in an excellent recent podcast with James Montier from GMO here.
Buying umbrellas on sunny days
At Wheelhouse we aim to always be prepared for the unexpected. This approach is why we always have downside protection strategies in place, designed to preserve capital through all seasons.
As part of this process, we are constantly monitoring option markets to take advantage of any opportunities that may arise. Towards the end of July, with volatility receding to the lowest point since 2019 and additionally forward discounting rates on their 20 year highs we were able to secure our hedging requirements at record low prices.
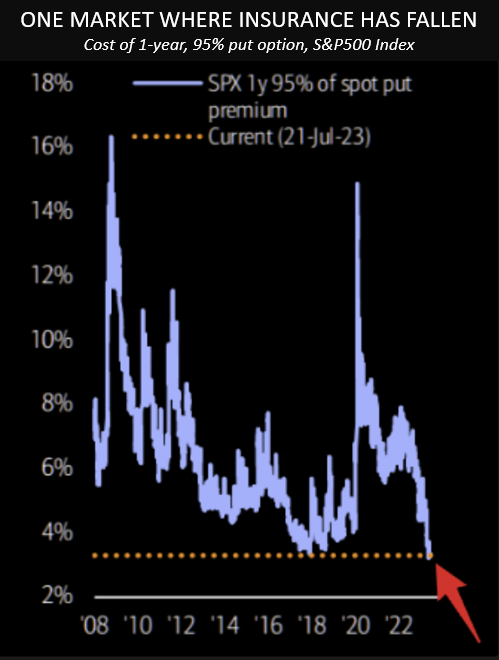
Should the market continue to rally the expense is negligible but were the market to fall our investors enjoy some protection – that is priceless.
In the news: Interview with Alastair MacLeod on ausbiz
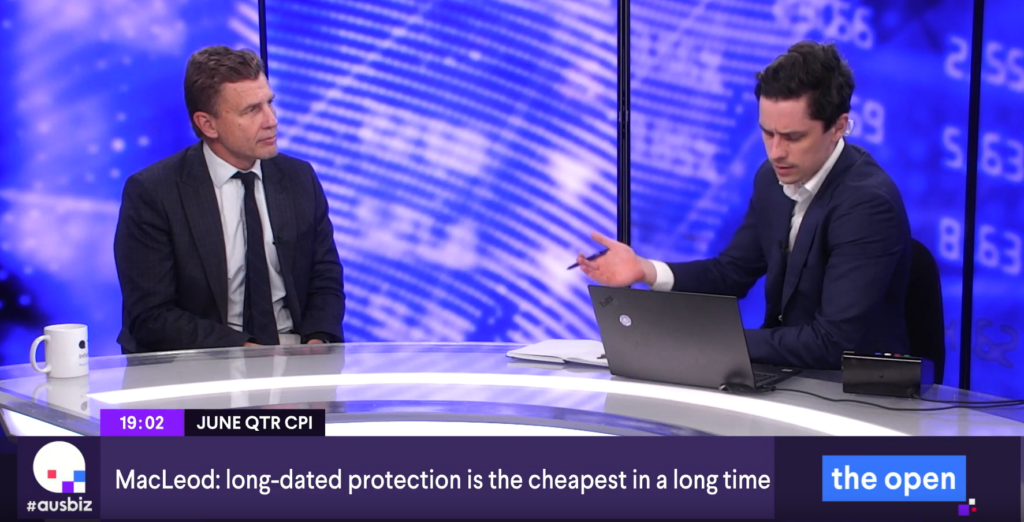
Watch Alastair MacLeod in a recent interview on ausbiz explaining four layered ways to protect a portfolio and how these work together to deliver all season defence within the Wheelhouse Global fund. [10mins]
Playing catchup: What's next for tech?
Quick follow up to our report from May with the same title. Wisdomtree have published some excellent analysis on the subsequent performance of stocks with peak Price/Sales multiples. Worth a read before buying NVDA on 17x sales.
Wheelhouse Global Equity Income Fund
7.5%
Income since inception p.a.
6.7%
Total return since inception p.a.
| 1 month | 1 year | 3 years p.a | 5 years p.a. | Since inception^ | |
| Income | 0.0% | 8.00% | 8.1% | 7.7% | 7.5% |
| Growth | 0.6% | 1.0% | (1.9%) | (1.6%) | (0.8%) |
| Total Return | 0.6% | 9.0% | 6.2% | 6.1% | 6.7% |
| RBA +2.5% | 0.5% | 5.8% | 3.7% | 3.7% | 3.7% |
| Benchmark* | 2.1% | 17.6% | 14.0% | 11.4% | 11.6% |
| Market Risk** | nm | 0.5 | 0.5 | 0.5 | 0.5 |
Performance figures are net of fees and expenses.
* Benchmark is the MSCI World Index (ex-Australia).
** Risk is defined as Beta and sourced from Morningstar Direct. Beta is represented vs the Benchmark and vs the S&P/ASX 200 Index. A Beta of 1.00 represents equivalent market risk to the comparison Index. A minimum of 12 months data is required for the calculation.
^ Inception date is 26/05/2017. Since inception figures are calculated on a p.a. basis. Past performance is not an indicator of future performance.
Click here to read the full performance report of the Wheelhouse Global Equity Income Fund.
Wheelhouse Australian Enhanced Income Fund
10.7%
Income since inception p.a.
7.7%
Total return since inception p.a.
| 1 month | 3 months | 6 months | 1 year | Since inception^ | |
| Income* | 0.0% | 1.5% | 4.6% | 10.5% | 10.7% |
| Growth | 1.7% | 0.3% | (2.9%) | 1.2% | (3.0%) |
| Total Return | 1.7% | 1.8% | 1.7% | 11.7% | 7.7% |
| Benchmark** | 2.9% | 2.2% | 2.0% | 13.5% | 9.4% |
| Excess return | (1.2%) | (0.4%) | (0.3%) | (1.8%) | (1.7%) |
Performance figures are net of fees and expenses.
* Income includes cash distributions and the value of franking credits and special dividends. Cash distributions are paid quarterly.
** Benchmark is the S&P/ASX 200 Franking Credit Adjusted Daily Total Return Index (Tax-Exempt).
^ Inception date is 9/03/2021. Since inception figures are calculated on a p.a. basis. Past performance is not an indicator of future performance.
Click here to read the full performance report of the Wheelhouse Australian Enhanced Income Fund.