- February 20, 2024
The other Taylor bump
While some parts of Australia are benefiting from the Taylor Swift economic bump this week, investors may find it worthwhile listening to a different ‘Taylor’, which may provide a more material boost to their portfolios.
'The man'
Devised by John Taylor in the 1990’s, the Taylor Rule was designed as a guide to setting US central bank monetary (interest rate) policy. The rule takes into account the twin objectives of the Federal Reserve (namely price stability (inflation) and full employment), to calculate a balanced guide for interest rate policy settings in the US.
As the chart below highlights, the Taylor Rule has historically provided a valuable guide for interest rate policy setting in the US.
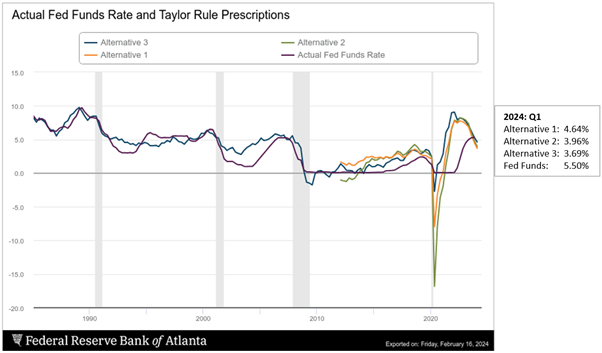
The Atlanta Fed maintains an excellent website for interested policy observers to see where this well respected rule-of-thumb is suggesting interest rates should be set.
While calculated slightly differently across the three different Alternatives, in all cases the model is suggesting a continuing loosening of interest rate policy in the US, with model readings ranging from 4.6% to 3.7%, all at a reasonable discount to the current Federal reserve upper bound of 5.50%.
Should policy settings continue to ease throughout 2024, as is suggested by the Taylor Rule and reflected in market futures, the tailwinds for equity markets may be well supported.
'Shake it off'
One potential fly in the ointment remains sticky services inflation. While anyone reading the top section of the table below may feel inflation is on the back foot, the bottom half of the table (services) unfortunately tells a different story.
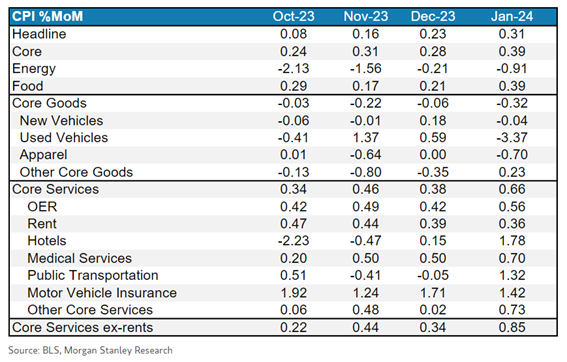
As evidenced by the market impact of a slightly hotter than expected CPI print last week, investor sentiment is clearly not positioned for inflation to be stickier than expected. Although judging by the market recovery in subsequent days, many were able to simply… shake it off.
'Is it over now?'
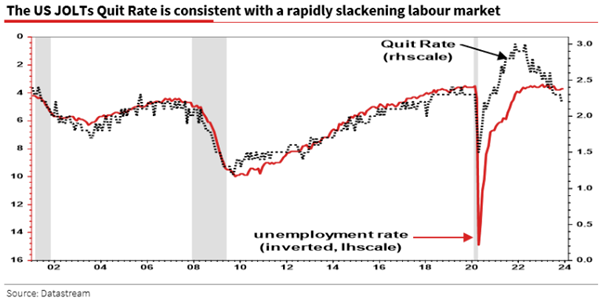
One constant of the US economy in the post-pandemic era has been the bullet-proof labour market, which has contributed to the robust services inflation evidenced above.
Recent analysis by Bloomberg highlights that while the unemployment rate has remained largely stable (and representative of near full employment), there are structural reasons to believe that this measure is underestimating an underlying weakness in US employment. The chart below from Societe Generale supports this, highlighting fewer workers are quitting and is representative of a ‘rapidly slackening’ labour market.
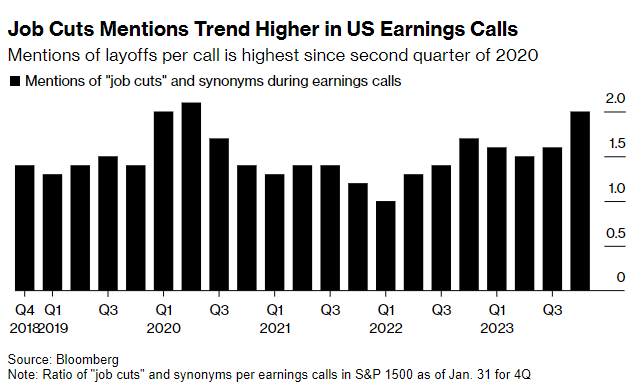
Furthermore, the following chart suggests companies are also considering increased layoffs, with an increasing number of US companies discussing layoffs on their earnings calls.
'Delicate'
Should the labour market be genuinely cooling, this weakness may prove the perfect antidote to the sticky services inflation referenced above and assist with a continued easing of Federal Reserve policy settings. Exactly what the Taylor Rule is suggesting.
However, the “bad news is good news” dynamic that the market has been exhibiting recently will most likely revert to “bad news IS bad news” as a softening labour market is reflective of a slowing economy. Soft landings have proven difficult to land and while the consensus Goldilocks scenario may end up proving correct in 2024, we’d remind investors that… Goldilocks was actually a fairy tale.
As Taylor Swift says, “Just because you make a good plan, doesn’t mean that’s what’s gonna happen”. Taylor Rule or not, perhaps just be prepared for some bumps.
Safe travels to all the fellow inter-state Swiftie travellers this week, Al will be waiting in the carpark!
Why not 100% equities?

Cliff Asness at AQR has written an excellent article that resonates with us. This philosophy of targeting high risk adjusted returns, versus simply high returns, underpins the investment logic for everything we do.
Wheelhouse Global Fund
| 1 mo | 3 mo | 6 mo | 1 yr | 3 yrs (pa) | 5 yrs (pa) | S/I (pa) | |
| Total fund return | -0.1% | 6.2% | 0.0% | 4.1% | 5.6% | 6.4% | 6.2% |
| RBA+2.5%* | 0.6% | 1.7% | 3.4% | 6.7% | 4.5% | 4.0% | 4.0% |
| Risk (volatility) | – | – | – | 6.7% | 7.6% | 7.6% | 7.6% |
* The Fund’s benchmark is RBA +2.5% and is used for all time periods shown. From the Fund’s inception to 31 August 2023 the Fund’s benchmark was MSCI World ex Australia Index (AUD). The change in benchmark does not impact any fees the manager may earn and the Fund’s investment objective has not changed.
Performance figures are net of fees and expenses. Inception date is 26 May 2017. Past fund performance is not indicative of future performance.
Wheelhouse Australian Fund
| 1 mo | 3 mo | 6 mo | 1 yr | S/I pa^ | |
| Income* | 0.0% | 1.5% | 4.3% | 9.1% | 10.4% |
| Growth | 1.0% | 11.9% | 1.0% | -2.1% | -2.2% |
| Total Return | 1.0% | 13.5% | 5.3% | 7.0% | 8.2% |
| Benchmark** | 1.2% | 14.2% | 6.5% | 8.6% | 10.1% |
Performance figures are net of fees and expenses. Since inception numbers include 30bps exit spread.
* Income includes cash distributions and the value of franking credits and special dividends. Cash distributions are paid quarterly.
** Benchmark is the S&P/ASX 200 Franking Credit Adjusted Daily Total Return Index (Tax-Exempt).
^ Inception date is 09/03/2021. Since inception figures are calculated on a p.a. basis. Past performance is not an indicator of future performance.
For any questions or enquiries about our funds or investment strategies, please contact Wayne McGauley, Head of Distribution, via wayne.mcgauley@wheelhouse-