- March 28, 2024
When Mag-7 fades
The Magnificent 7 have mostly continued to be magnificent into 2024, although Tesla seems keen to make it the Magnificent 6.
Bubble or no bubble, one clear by-product of the outsized performance by outsized companies is that the level of market concentration has continued to build. It’s not just in the US either with concentration building in Europe through the outperforming GRANOLA stocks (sigh – markets love acronyms).
Market concentration is certainly not a new phenomenon, as fund manager Arcadian highlight in an excellent report. However, we should also note, the current level of concentration has not come close to anything we have seen in the past 30 years. So while concentration is not new, it’s important to understand what comes next.
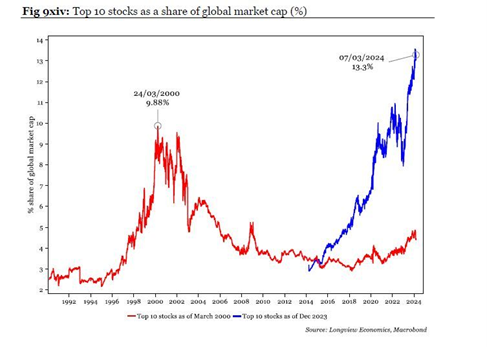
As the above chart suggests, all did not end well for the highly prized market darlings during the last spike in market concentrations. A decline in market concentration reflects the fact that these top 10 stocks underperformed in subsequent periods.
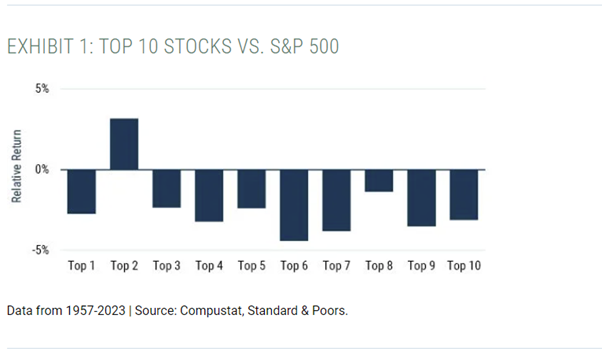
This underperformance of the top 10 appears to be a regular feature of markets and is not just confined to highly concentrated periods. Research by GMO reviews the returns of the 10 largest stocks in the S&P500 over a near 65-year period, with only 1/10 stocks subsequently outperforming over the following 12-month period. Not a great strike rate.
What works when concentrations unwind?
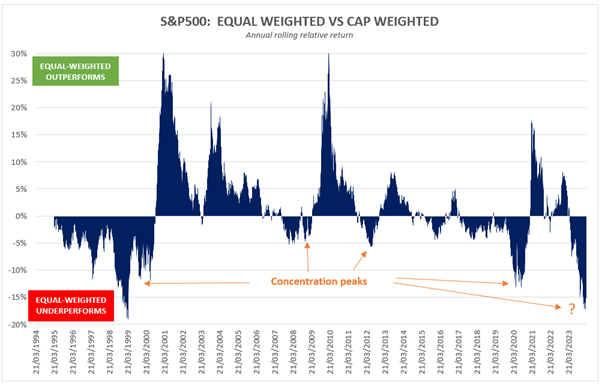
Following periods of excessive market concentration within cap-weighted indexes, equal weighted indexes have historically outperformed. Often materially so.
Concentration melt-down
Based on historical precedents, we would argue that increasing an equity exposure to be more equal-weighted makes sense at this point in time. As the market concentration dilutes, this should provide a tailwind to those cheaper and smaller stocks in the market.
Furthermore, our analysis of the 2000 tech concentration unwind clearly identifies an additional benefit when pairing an equal-weighted equity exposure with a cap-weighted BuyWrite overlay.
In the chart below we have plotted the returns of the S&P500 Cap-weighted Index and the S&P500 Equal-weighted Index during the 12-months following the tech bubble peak.
In addition, we’ve also included a combined strategy that owns the S&P500 Equal-weighted exposure and is paired with a rules-based BuyWrite overlay. This approach is similar in principle to the underpinnings of our Global Fund (long equal-weighted Quality equity portfolio/ cap-weighted Index BuyWrite).
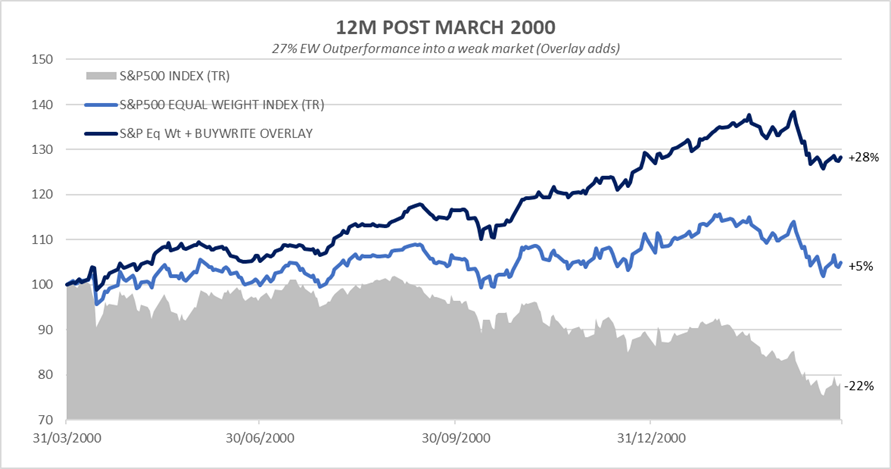
During the 12 months following the peak of the tech-bubble in March 2000, the combined strategy added material value during an otherwise tough year for the S&P500 Cap-weighted exposure.
For the record, we are not predicting the same scenario to play out this time around, however history shows that this strategy would likely perform exceptionally well were there to be:
- A reversion to mean of Equal-weighted versus Cap-weighted exposures, and/or
- Cap-weighted market weakness or lower growth
Should both occur, like in 2000, powerful tailwinds may well be repeated.
Outlook
At Wheelhouse we are not in the business of making strong directional forecasts. We’ve learned that these pursuits usually end in tears. We review history and focus instead on incorporating repeatable sources of excess return into our strategies, whether they be from traditional or non-traditional asset classes.
On this basis, we strongly believe the unusually high level of market concentration will fade, we just don’t know when. As the Acadian report suggests, market concentration is not a new thing and could get worse before it unwinds, but it has historically always unwound.
It seems logical to us that our Global fund, which relies on an equally-weighted Quality index exposure paired with primarily (Cap-weighted) Index options, is very well placed to deliver value in what may prove to be a more challenging market environment than what we have seen in recent years.
Webinars
Diversifying The Reliance On Negative Stock/Bond Correlations
Last month we hosted a webinar looking at how to diversify the reliance on negative stock/bond correlations, by providing an alternative solution – equity collars. Catch up on the webinar here. Or check out our two-part highlights videos below.
Upcoming Webinar
The well documented rise of the Magnificent 7 has created a very concentrated market cap-weighted index. Alastair MacLeod and Andrew MacLeod will discuss one approach that might materially benefit when Mag-7 fades and there’s an unwind in market concentration.
“What works when Mag-7 fades?”
Wednesday, 17 April
11am EST
30min
Wheelhouse Global Fund
| 1 mo | 3 mo | 6 mo | 1 yr | 3 yrs (pa) | 5 yrs (pa) | S/I (pa) | |
| Total fund return | 1.6% | 4.6% | 2.4% | 4.9% | 6.2% | 5.7% | 6.4% |
| RBA+2.5%* | 0.6% | 1.7% | 3.4% | 6.8% | 4.0% | 3.8% | 3.9% |
| Risk (volatility) | – | – | – | 6.8% | 7.6% | 7.4% | 7.6% |
* The Fund’s benchmark is RBA +2.5% and is used for all time periods shown. From the Fund’s inception to 31 August 2023 the Fund’s benchmark was MSCI World ex Australia Index (AUD). The change in benchmark does not impact any fees the manager may earn and the Fund’s investment objective has not changed.
Performance figures are net of fees and expenses. Inception date is 26 May 2017. Past fund performance is not indicative of future performance.
Wheelhouse Australian Fund
| 1 mo | 3 mo | 6 mo | 1 yr | S/I pa^ | |
| Income* | 0.3% | 1.6% | 4.2% | 9.4% | 10.2% |
| Growth | 1.1% | 7.5% | 2.9% | 1.2% | -1.7% |
| Total Return | 1.4% | 9.1% | 7.1% | 10.6% | 8.5% |
| Benchmark** | 1.0% | 9.6% | 8.1% | 12.3% | 10.2% |
Performance figures are net of fees and expenses. Since inception numbers include 30bps exit spread.
* Income includes cash distributions and the value of franking credits and special dividends. Cash distributions are paid quarterly.
** Benchmark is the S&P/ASX 200 Franking Credit Adjusted Daily Total Return Index (Tax-Exempt).
^ Inception date is 09/03/2021. Since inception figures are calculated on a p.a. basis. Past performance is not an indicator of future performance.
For any questions or enquiries about our funds or investment strategies, please contact Wayne McGauley, Head of Distribution, via wayne.mcgauley@wheelhouse-