- January 17, 2024
Cracks in the crystal ball
January is the season of forecasting, with many investors issuing predictions for the forthcoming 12 months. Unfortunately, forecasting such a short time period has proven exceptionally difficult to consistently get right.
For equity investors, it’s usually the valuation component that proves challenging.
Equity markets have only three possible return drivers… Dividends (relatively easy to forecast), Earnings (more difficult and usually tied to the economy), and finally the change in Valuation – which often has the most impact on equity returns in a given year, and is also the most unpredictable.
On the bright side, there is evidence that over the long-term, valuations can provide a reasonable guide to expected future returns. It’s just that over the short-term, like a year, there is very little forecasting ability baked into a Price/Earning (P/E) multiple.
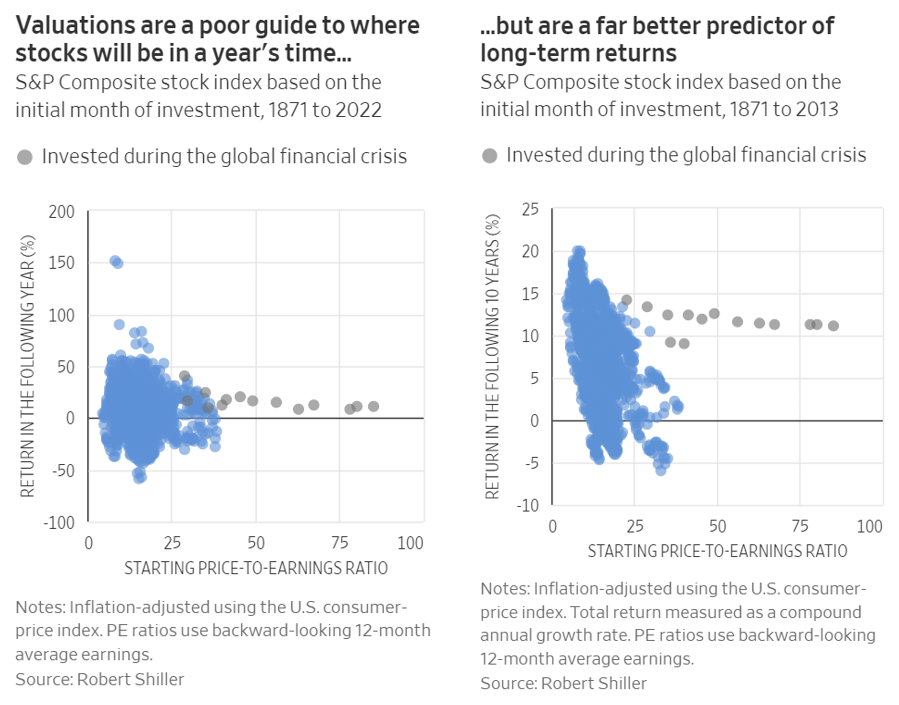
The blue blob in the chart on the left does not generate a lot of confidence in valuation’s predictive ability over the short-term.
The reason P/E multiples have some predictive power over the longer-term is mostly due to the mean reverting nature of the multiples. Buy when markets are expensive…over time the multiple is more likely than not to contract. Time is the key ingredient for the mean reversion to play out though.
Also from reference to the left hand scale of returns, bear in mind the wide dispersion of outcomes over the short-term, proving once again that prices are simply far more volatile than the underlying businesses’ earnings and especially dividends.
AQR have recently published an excellent article which expands on this subject and explains their relatively muted expectations for future US equity returns. Separately, there are a number of other resources to support the rationale of using cyclically adjusted PE multiples (CAPE) across different regions and time periods.
Some longer term forecasts
If CAPE ratios have proven to be useful in determining longer-term asset returns, then where do opportunities present today? Using Bloomberg data we’ve plotted CAPE multiple for a range of regions and investment styles below.
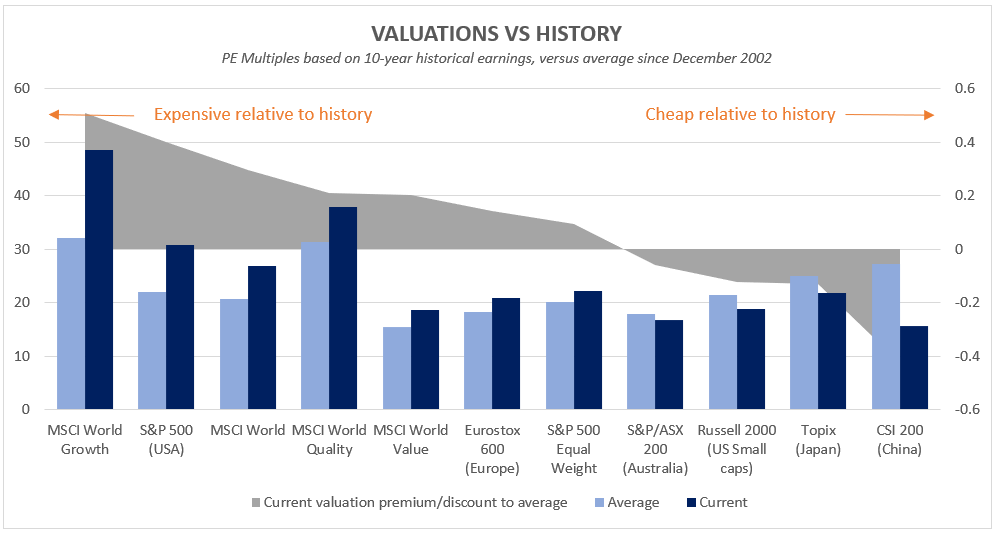
Some observations:
Equity market valuations that include the mega-cap Growth names, appear expensive relative to history. Critics might argue that trailing earnings (which CAPE analysis is based upon) does not capture the future explosive growth potential from Artificial Intelligence (AI)… but it seems clear there is a reasonable amount in the price for the earnings growth potential.
In our view, a simple way to reduce this risk, yet include valuable diversification, is moving to a more Equally Weighted Index (such as S&P500 EW), where valuations are close to average with the 20-year history.
The Australian market screens at a slight discount to fair value. With the highest income component (the most reliable element of assessing future returns), we believe Australian equities are hard to go past at current levels.
US Small caps (Russell 2000 Index) are screening as slightly cheaper than average, despite the +20% rally in the 4Q.
Japan and particularly China appear to be deep value contrarian exposures, at least from a PE valuation perspective. Perhaps China for good reason given the change in perspective on the rights of shareholders in recent years, but certainly one for the contrarians to consider.
How are we positioned?
Investors would know we don’t pick stocks and rely on broad indexes for our equity exposures.
Our Global fund relies on an equally weighted index which removes much of the valuation froth surrounding AI. While this lack of mega-cap tech exposure was a drag on performance during 2023, looking forward we believe the positioning delivers far less risk of a valuation headwind, yet still provides a diversified exposure to Global Quality.
Our Australian fund owns a portfolio with similar weights to the ASX200 Index, but through internal gearing aims to increase the dividend income exposure to nearly 2x yet maintains a market like risk exposure.
As a fundamental philosophy we value the increased certainty that higher income generation adds to portfolio returns, which is one of the characteristics of BuyWrite strategies that we specialise in. Through introducing this 4th source of return (on top of dividends, earnings growth and valuation), we enjoy the increased certainty this can provide to investment returns and the diversification benefits this additional source of income return can deliver to traditional equity portfolios.
Forecasting returns over the next 12 months remains as unpredictable as ever… but through a focus on increasing the income component of return – the most consistent and reliable component – we believe the range of outcomes will likely be far more acceptable across all market scenarios.
Catch Alastair’s latest ausbiz interview
Alastair recently joined Juliette Saly on ausbiz, talking about what volatility levels mean for the markets and how to take advantage of low volatility without trying to time the market.
Wheelhouse Global Fund
| 1 mo | 3 mo | 6 mo | 1 yr | 3 yrs (pa) | 5 yrs (pa) | S/I (pa) | |
| Total fund return | 3.1% | 4.5% | 0.7% | 5.5% | 5.7% | 6.5% | 6.3% |
| RBA+2.5%* | 0.6% | 1.7% | 3.4% | 6.6% | 4.3% | 3.9% | 4.0% |
| Risk (volatility) | – | – | – | 6.8% | 7.6% | 7.6% | 7.7% |
* The Fund’s benchmark is RBA +2.5% and is used for all time periods shown. From the Fund’s inception to 31 August 2023 the Fund’s benchmark was MSCI World ex Australia Index (AUD). The change in benchmark does not impact any fees the manager may earn and the Fund’s investment objective has not changed.
Performance figures are net of fees and expenses. Inception date is 26 May 2017. Past fund performance is not indicative of future performance.
Wheelhouse Australian Fund
| 1 mo | 3 mo | 6 mo | 1 yr | S/I pa^ | |
| Income* | 1.1% | 1.5% | 4.4% | 9.4% | 10.6% |
| Growth | 5.3% | 5.7% | 1.6% | 1.9% | -2.5% |
| Total Return | 6.4% | 7.3% | 5.9% | 11.3% | 8.1% |
| Benchmark** | 7.3% | 8.6% | 8.3% | 14.0% | 9.9% |
Performance figures are net of fees and expenses. Since inception numbers include 30bps exit spread.
* Income includes cash distributions and the value of franking credits and special dividends. Cash distributions are paid quarterly.
** Benchmark is the S&P/ASX 200 Franking Credit Adjusted Daily Total Return Index (Tax-Exempt).
^ Inception date is 09/03/2021. Since inception figures are calculated on a p.a. basis. Past performance is not an indicator of future performance.
For any questions or enquiries about our funds or investment strategies, please contact Wayne McGauley, Head of Distribution, via wayne.mcgauley@wheelhouse-