- September 15, 2022
Reading the Recession Tea Leaves
When it comes to predicting recessions, there are many ways to read the tea leaves and come to a view on the future. We like the following chart which plots energy and food inflation versus the economic cycle.
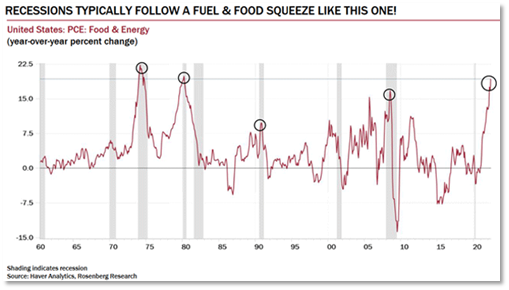
The point of the chart is that the spike in energy and food costs cause such meaningful demand destruction, that as a result the economy is pushed into contraction. A review of year-to-date performance by sector reinforces this point… usually when energy is doing well (and it is doing very very well), the rest of the economy is struggling.
Reading the Recession Tea Leaves
On average, markets have historically experienced earnings downgrades of around 15% during more cyclical recessions. This excludes the more structural recessions such as during the GFC when bank profitability evaporated. With banks far better capitalised this time around, should our read of the tea leaves prove prescient we see no reason that earnings downgrades shouldn’t approach historic averages.
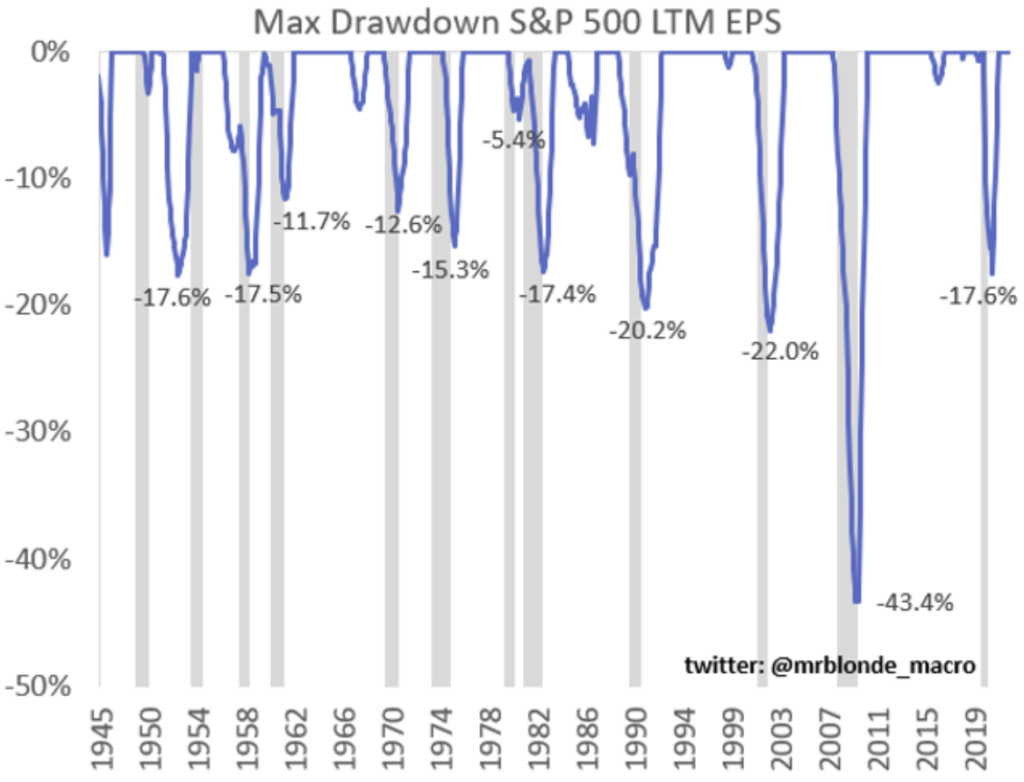
Factset reported this week that earnings downgrades in the US are currently running at -5.5% off their peak, so if history is any guide, it seems reasonable to assume there is another 10% of downside still to come. Combined with a hawkish Fed where multiples are more likely to be below average than above, it’s not difficult to envisage a 15-20% pullback as the recessionary storm clouds peak.
What works during a Recession
Studies have shown that within equities, businesses with strong balance sheets, more stable margins, and higher levels of profitability have consistently outperformed during economic slowdowns. This makes intuitive sense as markets focus more on what can go wrong vs what can go right, and the flight to Quality takes hold.
Dividends and income strategies have also fared well and our own research has shown that systematic income producing Overlay strategies have also consistently weathered economic slowdowns better than the broader market.
In the chart below we plot the relative value add of Quality shares, plus returns from Overlay strategies, during periods when economic slowdowns start to bite.
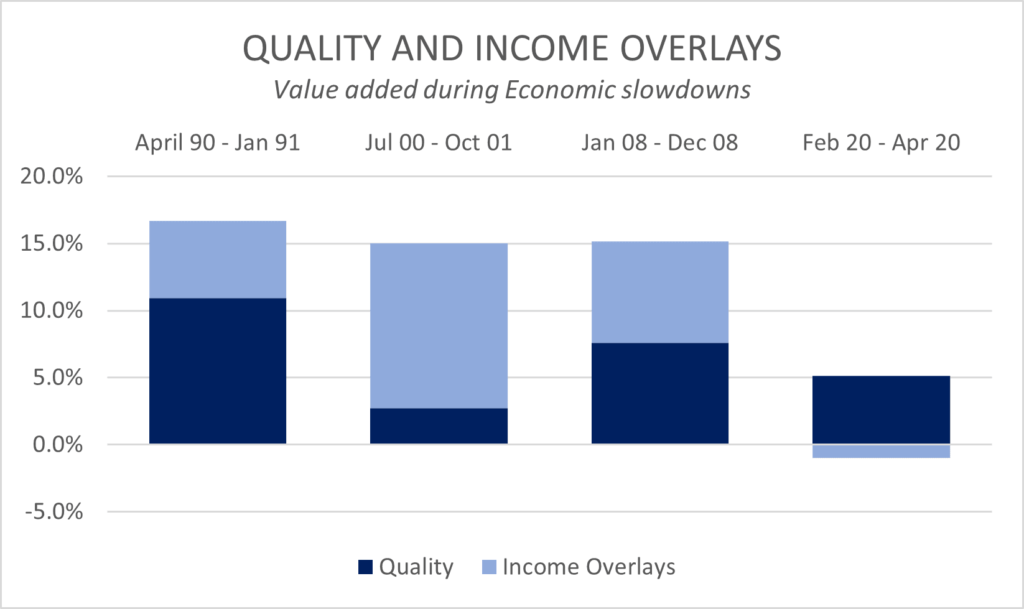
In nearly all economic contractions, both Quality and Overlays worked together to meaningfully preserve capital (we have written further on why Overlays were less defensive during Covid and the role of tail hedging).
While over the past year Quality has underperformed the market (and has been a drag on our Global fund returns), it seems clear that with the limited earnings downgrades a genuine economic slowdown has yet to be priced. Thus far in 2022, most of the equity market downside has come from more hawkish macro policy and resultant PE de-rating. However, should economic conditions continue to deteriorate from here and earnings revisions accelerate, then it seems reasonable that a flight to Quality would once again bear fruit for defensively minded investors.
Even though Value shares and Energy in particular have led the market year to date, these exposures have typically proved far less defensive when demand destruction is most acute. Cyclicals are named as such for a reason, and despite low PE multiples the hit to earnings may surprise many on the downside.
What if we’re wrong
If our read of the tea leaves is incorrect and the storm clouds quickly pass, then at least we have remained fully invested in a high quality, highly income generative portfolio, which should produce reasonable returns even in a lower growth or recovery environment. Perhaps not as well as a basket of small caps or more cyclical exposures, but if we’re right there will be another time to look for these more cyclical exposures at lower prices.
However, should we enter a more ‘typical’ recession and history is any guide, then the combination of Quality plus Income may once again prove valuable by working to preserve capital in any further equity market drawdown.
Wheelhouse Global Equity Income Fund
7.7%
Income over 5 years (p.a.)
6.9%
Total Return over 5 years (p.a.)
| 1 month | 1 year | 3 years (p.a.) | 5 years (p.a.) | Since inception^ | |
| Income | – | 6.65% | 7.32% | 7.66% | 7.27% |
| Growth | (2.17%) | (14.90%) | (4.69%) | (0.79%) | (1.56%) |
| Total Return | (2.17%) | (8.25%) | 2.64% | 6.88% | 5.72% |
| Benchmark* | (2.54%) | (9.62%) | 8.21% | 11.12% | 9.80% |
| Risk (Beta)** | nm | 0.39 | 0.43 | 0.50 | 0.60 |
Performance figures are net of fees and expenses.
* Benchmark is the MSCI World Index (ex-Australia).
** Risk is defined as Beta and sourced from Morningstar Direct. Beta is represented vs the Benchmark and vs the S&P/ASX 200 Index. A Beta of 1.00 represents equivalent market risk to the comparison Index. A minimum of 12 months data is required for the calculation.
^ Inception date is 26/05/2017. Since inception figures are calculated on a p.a. basis. Past performance is not an indicator of future performance.
Click here to read the full performance report of the Wheelhouse Global Equity Income Fund.
Wheelhouse Australian Enhanced Income Fund
7.7%
Income since inception (p.a.)
6.9%
Total return since inception (p.a.)
| 1 month | 3 months | 6 months | Since inception^ | |
| Income* | 0.30% | 1.92% | 5.88% | 6.62% |
| Growth | (0.06%) | (2.75%) | (0.01%) | 6.34% |
| Total Return | (0.24%) | (0.83%) | 5.87% | 12.96% |
| Benchmark** | (0.40%) | 2.01% | 4.08% | 10.80% |
| Excess return | 0.64% | 1.18% | 1.79% | 2.16% |
Performance figures are net of fees and expenses.
* Income includes cash distributions and the value of franking credits and special dividends. Cash distributions are paid quarterly.
** Benchmark is the S&P/ASX 200 Franking Credit Adjusted Daily Total Return Index (Tax-Exempt).
^ Inception date is 9/03/2021. Since inception figures are calculated on a p.a. basis. Past performance is not an indicator of future performance.
Click here to read the full performance report of the Wheelhouse Australian Enhanced Income Fund.