- December 14, 2021
Rolling returns point to slower growth ahead
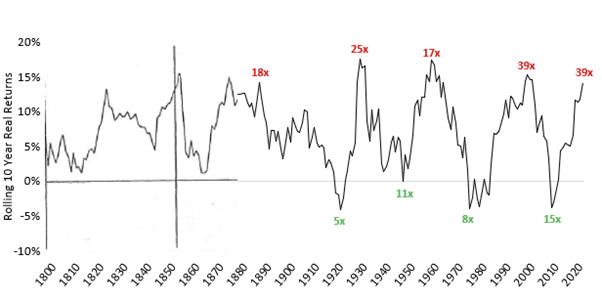
As markets continue to push new boundaries in terms of price and valuation metrics, it’s worth a glance back to see where we are relative to history. While the past is never prologue, the rhythm of historical rolling returns in the chart below (credit Kailesh Concepts) is quite compelling. Despite delivering an average long-term return of 9-10%, equity returns are rarely delivered linearly.
Overlaid on the rolling return profile is the Schiller PE multiple, which not surprisingly has a high correlation to market peaks and troughs. After 10 years of near 15% average growth in US equity markets, both rolling returns and valuation multiples are currently close to touching their historic peaks. These metrics are entirely consistent with an environment of high corporate profits, low interest rates and a favourable taxation regime.
However as the chart also highlights, the growth pendulum historically reverts, suggesting future sharemarket gains are likely to be far more challenging than what we have come to experience as ‘normal’ the past ten years. This outlook is entirely consistent with the views outlined in our October monthly report.
Of note, markets don’t need to actually fall for the slope of the ten year growth line to turn negative. A trending sideways market would also have the effect of reducing growth and valuation multiples. While there are plenty of reasons why markets may fall, a lower return environment may simply be the least painful path for these multiples to normalise.
Given the predominantly systematic nature of our investment process we never try to predict precisely when these return profiles will roll over. Market timing calls are notoriously difficult to get right, we would argue near impossible. We do however have a great deal of confidence in one of our core beliefs – that income has the capacity to smooth returns and by doing so reduces the significance of market timing. Through generating most of our returns via income, our funds are less reliant on the movements in capital to deliver on our objectives.
We believe this approach will be rewarded should the historical rhythm return in coming years.
Wheelhouse Global Equity Income Fund
8.0%
Income over 3 years (p.a.)
9.1%
Income over 3 years (p.a.)
| 1 month | 1 year | 3 years (p.a.) | Since inception^ | |
| Income | 0.00% | 8.75% | 7.97% | 7.35% |
| Growth | 2.35% | 1.64% | 1.08% | 1.01% |
| Total Return | 2.35% | 10.39% | 9.05% | 8.36% |
| Benchmark* | 3.70% | 26.81% | 18.19% | 14.59% |
| Risk (Beta)** | n/a | 0.76 | 0.45 | 0.60 |
Performance figures are net of fees and expenses.
* Benchmark is the MSCI World Index (ex-Australia).
** Risk is defined as Beta and sourced from Morningstar Direct. Beta is represented vs the Benchmark and vs the S&P/ASX 200 Index. A Beta of 1.00 represents equivalent market risk to the comparison Index. A minimum of 12 months data is required for the calculation.
^ Inception date is 26/05/2017. Since inception figures are calculated on a p.a. basis. Past performance is not an indicator of future performance.
Click here to read the full performance report of the Wheelhouse Global Equity Income Fund.
Wheelhouse Australian Enhanced Income Fund
Performance numbers below are based on exit prices. Since inception returns include the 30bps exit spread.
| 1 month | 3 months | 6 months | Since inception^ | |
| Income* | 0.30% | 1.92% | 5.88% | 6.62% |
| Growth | (0.06%) | (2.75%) | (0.01%) | 6.34% |
| Total Return | (0.24%) | (0.83%) | 5.87% | 12.96% |
| Benchmark** | (0.40%) | 2.01% | 4.08% | 10.80% |
| Excess return | 0.64% | 1.18% | 1.79% | 2.16% |
Performance figures are net of fees and expenses.
* Income includes cash distributions and the value of franking credits and special dividends. Cash distributions are paid quarterly.
** Benchmark is the S&P/ASX 200 Franking Credit Adjusted Daily Total Return Index (Tax-Exempt).
^ Inception date is 9/03/2021. Since inception figures are calculated on a p.a. basis. Past performance is not an indicator of future performance.
Click here to read the full performance report of the Wheelhouse Australian Enhanced Income Fund.