- February 10, 2022
Why inflation will cool in coming months
Right now it feels like inflation is everywhere. At the petrol pump, in the supermarket, at the butcher especially. Indeed, inflation prints particularly in the US are running hot and expected to touch 7.3% for January. As a result, brokers have been rushing to forecast 4 or even 5 hikes to interest rates during 2022 in the US, as they try to predict what it will take for the Federal Reserve to get back in front of the curve when it comes to dealing with inflation.
However, longer-term market expectations for inflation appear to be cooling. TIPs Breakevens, which measure the spread between nominal and inflation protected bonds (and hence, provide an excellent market-based estimate of future inflation), have fallen from their peak the past few months. This is despite the continued spike in short-term inflation.

We believe the primary reason for this divergence is the market looking forward and recognising that supply chain issues are likely to ease in future months. Until now, supply chain issues have proven to be the key exogenous shock driving higher inflation, whether this be Covid-driven labour shortages at the wharves, abattoirs or driving trucks, or 5x higher container shipping costs. It seems natural that as these roadblocks are removed, inflation will likely fall.
In fact in recent months, shipping costs have already started to fall. Particularly for bulk commodities (refer Baltic Dry Index down 70% from peak), but also for containers, costs look to be falling across all routes. While container shipping prices remain very elevated relative to history inferring more short-term pain, pricing looks to have peaked in October around the same time inflation expectations rolled over.
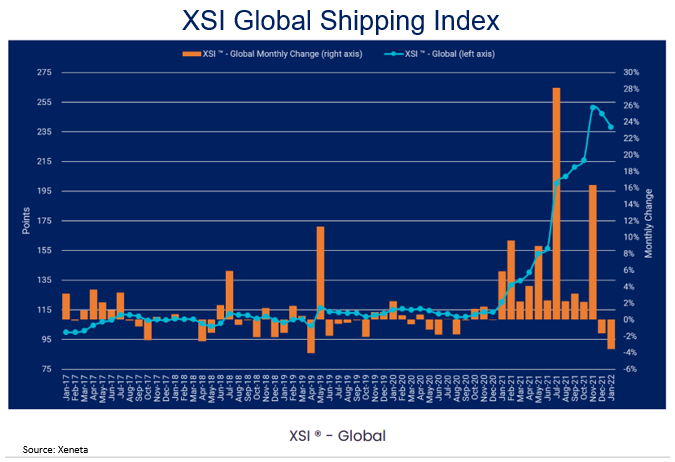
Contributing to the expected future decline in shipping costs will likely be the massive increase in capacity expected to arrive later this year and into 2023.
- In 2021, the number of container vessels ordered surpassed 2017, 2018, 2019 and 2020 combined as reported by VesselsValue, and was driven by “unprecedented box demand”.
- Clarkson Research estimate there are currently orders for 5.7m TEU, which represents a quarter of the total global containership capacity.
Furthermore, on the demand side of the equation, with continued re-opening we believe the demand pressure points will also cool, as global economies reposition for increased spending on services such as travel, restaurants and entertainment. Since the onset of the pandemic the nature of spending on durable goods (stay at home) has been particularly elevated, which should reverse as economies reopen. This in turn should partially reduce the acute demand for shipping containers and durable goods coming out of Asia and thus help ease prices.
Wage pressures remain a risk to the scenario of moderating inflation, although pressures to date have been mild and the low participation rate suggests to us that there is some latent capacity in labour markets should higher wages materialise, attracting workers back into the market.
Sentiment already shifting
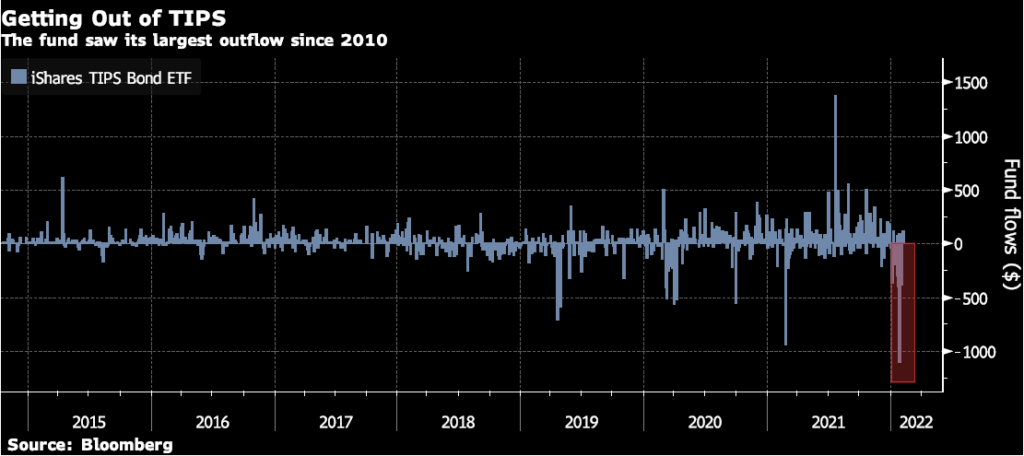
Many investors are already voting with their feet in terms of changing their inflation expectations. In recent weeks the iShare TIPS Bond ETF has seen record outflows as investors revaluate the need for specialised inflation protection within their portfolios.
Implications for markets
One major concern of markets, particularly during January, is that the Federal Reserve has been boxed into a position of having to aggressively raise rates to counter the surge in inflation, regardless of the health of the underlying economy. This is exactly what happened in 2008 when the ECB was forced to hike to address rising inflation only to have to aggressively slash rates three months later as the GFC unfolded. Should supply chain issues subside a little sooner than expected, and inflation expectations wane, the risk of policy error in our view diminishes.
Assuming the Fed manages to thread the needle and avoid policy error, this may potentially provide support to equity markets in the short-term as quite often markets do well in the initial stages of the hiking cycle. Particularly in the current environment as real interest rates remain negative (very accommodative), and the economy continues to remain strong and re-open.
Further out however, the facts remain that we are entering a tightening cycle which should subdue equity market gains (from a valuation perspective), plus at some point cool the economy (and slow earnings growth). Neither of these are positive for equity markets, and as inflation subsides and real interest rates continue to rally, we could get to this point relatively swiftly.
As we transition to this genuine tightening cycle we expect a roller coaster ride for equity markets, which despite the higher volatility should still be able to deliver acceptable, although more muted, returns than previous years. Particularly relative to other asset classes which may be more challenged in a rising rate environment, defensive equities look a good place to be.
January performance
Wheelhouse Global
During previous times of market stress we have often highlighted how our Global fund has performed as the defensive characteristics come to the fore. The Global fund delivered positive returns for the month and was never worse than 2% down at any point, despite near double digit declines at times for the S&P 500. The chart below highlights the daily movements in January of the fund with the light blue line illustrating the AUD unit price.
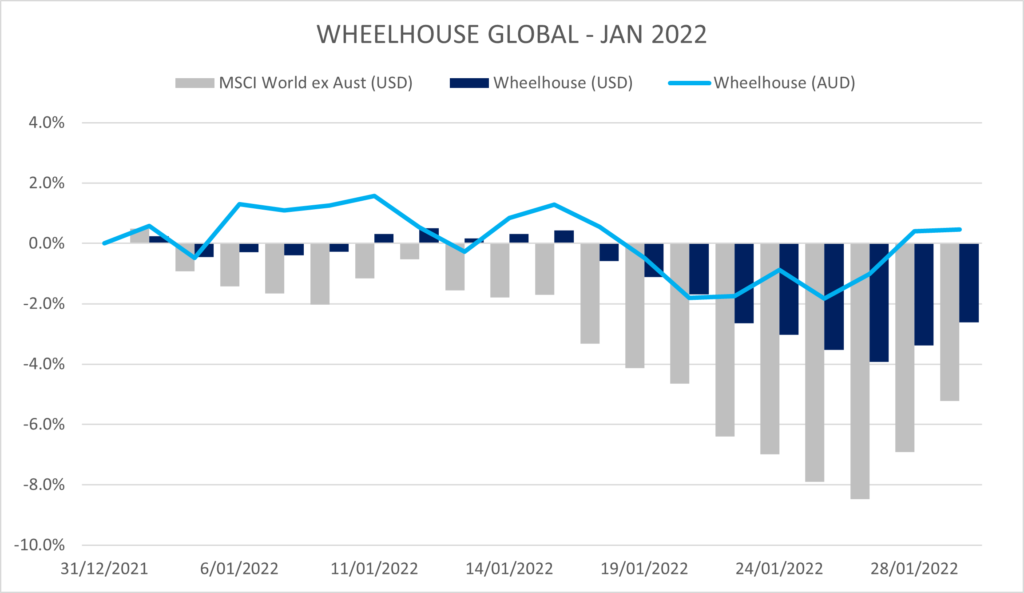
Drawdown was consistently less than 50% of the market in USD, inline with our risk targeting of only assuming half the market risk. This performance is entirely consistent with the performance of the fund during other peak to trough drawdowns, where on all previous market corrections was able to preserve wealth and deliver a positive return in AUD when markets were free falling.
Wheelhouse Australian
Our Australian fund has an entirely different objective to Global, targeting relative outperformance through the cycle while assuming full market risk to do this. We do expect higher returns over time, albeit with a bumpier ride. During market corrections of 5-7% we do expect a little underperformance which came through, however we expect this to be more than offset with outperformance in most other months (February numbers are on track to evidence this).
Importantly, should markets have continued to fall the portfolio risk is designed to fall at a faster rate than the market providing some protection in more acute falls.
Wheelhouse Global Equity Income Fund
8.1%
Income over 3 years (p.a.)
9.8%
Income over 3 years (p.a.)
| 1 month | 1 year | 3 years (p.a.) | Since inception^ | |
| Income | 0.00% | 8.85% | 8.09% | 7.46% |
| Growth | 0.46% | 5.26% | 1.68% | 0.77% |
| Total Return | 0.46% | 14.12% | 9.77% | 8.23% |
| Benchmark* | (2.20%) | 27.30% | 18.11% | 13.89% |
| Risk (Beta)** | n/a | 0.69 | 0.45 | 0.60 |
Performance figures are net of fees and expenses.
* Benchmark is the MSCI World Index (ex-Australia).
** Risk is defined as Beta and sourced from Morningstar Direct. Beta is represented vs the Benchmark and vs the S&P/ASX 200 Index. A Beta of 1.00 represents equivalent market risk to the comparison Index. A minimum of 12 months data is required for the calculation.
^ Inception date is 26/05/2017. Since inception figures are calculated on a p.a. basis. Past performance is not an indicator of future performance.
Click here to read the full performance report of the Wheelhouse Global Equity Income Fund.
Wheelhouse Australian Enhanced Income Fund
Performance numbers below are based on exit prices. Since inception returns include the 30bps exit spread.
| 1 month | 3 months | 6 months | Since inception^ | |
| Income* | 0.00% | 1.15% | 3.17% | 7.15% |
| Growth | (8.64%) | (6.94%) | (7.06%) | (0.98%) |
| Total Return | (8.64%) | (5.78%) | (3.89%) | 6.17% |
| Benchmark** | (6.35%) | (4.15%) | (3.13%) | 6.63% |
| Excess return | (2.29%) | (1.63%) | (0.79%) | (0.46%) |
Performance figures are net of fees and expenses.
* Income includes cash distributions and the value of franking credits and special dividends. Cash distributions are paid quarterly.
** Benchmark is the S&P/ASX 200 Franking Credit Adjusted Daily Total Return Index (Tax-Exempt).
^ Inception date is 9/03/2021. Since inception figures are calculated on a p.a. basis. Past performance is not an indicator of future performance.
Click here to read the full performance report of the Wheelhouse Australian Enhanced Income Fund.