- September 13, 2021
What’s with all these 'Global Supply Chain Issues'? Do they matter?
Supply chain issues were cited by company management numerous times during the recent reporting season and were attributed as one of the key reasons behind operational cost increases, logistical breakdowns and inventory increases.
For example, Resmed CEO Mick Farrell said: “Global supply chain limitations, including a shortage of electronic components, as well as ongoing freight constraints and costs, are impacting our ability to respond to the unprecedented increase in demand for ResMed products,”. There were many other companies also commenting with similar views.
While newswires have focused on the shortage in semiconductors and the resultant 30% decrease in US Auto manufacturing volumes, the global supply chain issue is much broader when the interconnected global network of shipping is considered.
The chart below illustrates the price of shipping a container from China to various major Western ports. The trend is similar for the Baltic Dry Index, which measures bulk shipping rates (eg grains and metals).
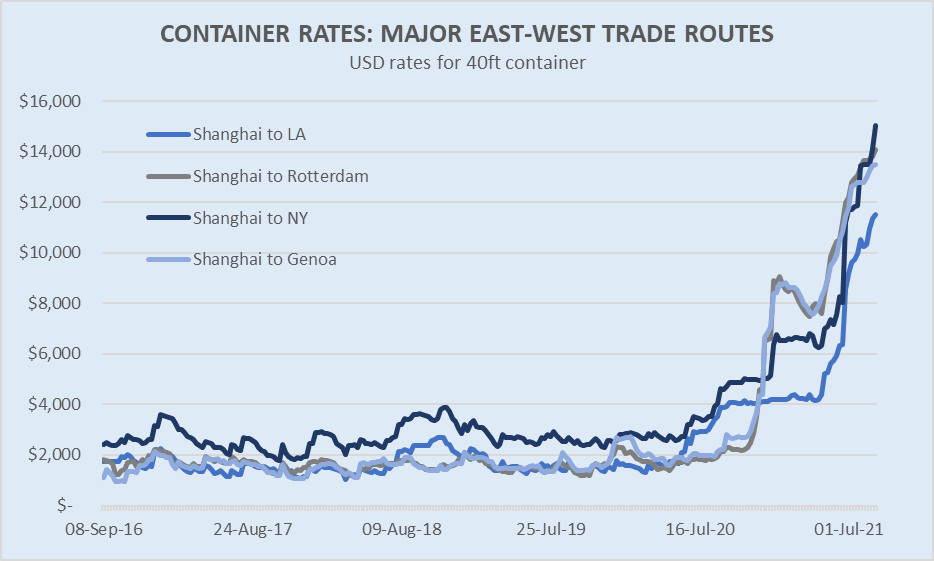
Cargo shipping is typically a very inelastic industry on the supply side, as ships take around two years to build and are expensive to remove from service for short intervals. Hence when demand shifts, the price can move materially.
There are two reasons behind the massive price spike witnessed in 2021:
1. The stop-start (lockdown vs stimulus) affected global recovery.
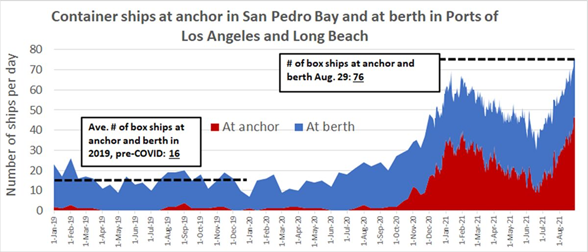
While usually shipping rates can be a good leading indicator for global growth, the ‘pop’ in pricing during 2021 is also reflective of supply side issues. Historically the global supply chain, and the shipping industry that underpins it, operates in an orderly market with a relatively smooth flow of containers and ships around the world. However, due to the stop-start nature of the current economy, this orderly flow has been majorly impacted. Some recent incidents include:
- China’s third busiest port partially shuts down this month due to a Coronavirus outbreak;
- a Japanese factory that controls 40% of the global market for a specific iphone component is shuttered for a week, again due to a Coronavirus outbreak, and;
- chronic labour shortages in the American trucking market force operators to look overseas for drivers…
… all of these ‘isolated’ events are happening at all points of the supply network. When ships are delayed at port, the containers waiting patiently on those ships are meant to be ferrying goods elsewhere. This delay then in turn creates bottlenecks at trucking and rail hubs, and means containers are far less likely to be where they are meant to be at the right time.
Hence the global nature of the pandemic and the de-synchronised growth that has resulted, has been a major contributor to supply chain issues.
2. Demand spike for durable goods
Consumer demand has also materially changed. The table below illustrates demand for Durable goods and consumer products, versus demand for services.
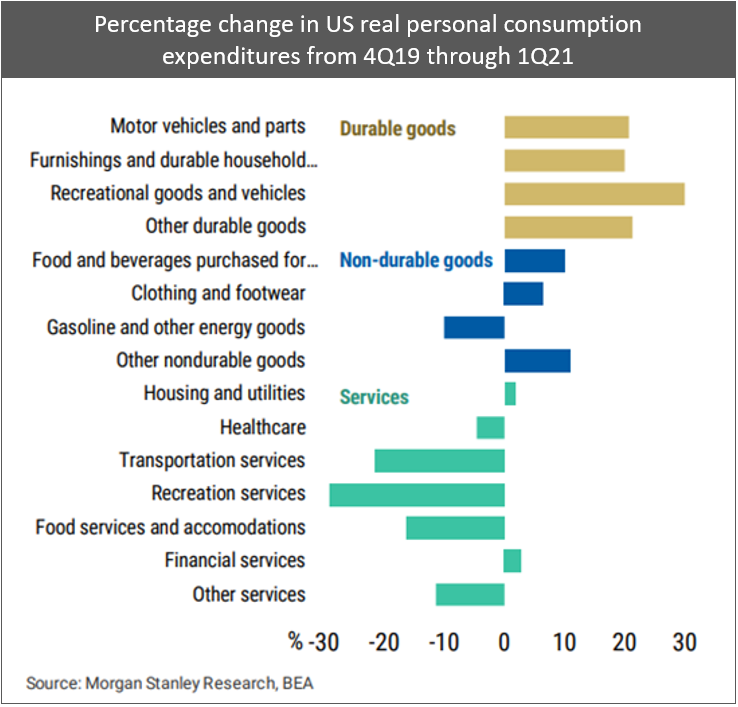
Once again, the pandemic has created a major disruption but this time on the demand side. Consumers are spending their money on cars and consumer goods, and far less on services like travel and restaurants. This is creating huge demand for exported goods out of Asia and creates a major capacity imbalance relative to the traditional flow of goods that operated pre pandemic.
How long before this is resolved?
Shipping companies have placed record orders with ship-builders to improve the supply of ships, however given the time lag it is unlikely these will have major impact for another 18-24 months.
Meanwhile demand for consumer and durable goods appears likely to remain elevated, with the stop-start economy and travel restrictions continuing to impact the speed of re-openings.
When combined, it is difficult to see Supply Chain issues and the elevated costs that accompany them, as being addressed in the next 12 months. Indeed, shipping index provider Drewry suggests rates are likely to go higher in the near-term during the run into black Friday sales and Christmas.
What is the impact?
Supply chain issues are likely to be with us for some time to come. While the impact is difficult to quantify and will vary across companies and industries, what seems clear is that cost inflation and the impact on corporate profitability is likely to keep prices well supported for the foreseeable future.
This leads us to believe that the definition of inflation as ‘transitory’ is likely to be extended, and it’s usage may end up being very ‘un-transitory’ in and of itself!! In any case, the timeline certainly seems beyond what was originally envisaged by the Federal Reserve when the Chairman Powell raised the term around the March 2021 FOMC meeting.
While we remain of the view that we are unlikely to see the inflation shocks of the 1970’s, even a modest level of underlying inflation – that proves more enduring – may well move interest rates a little quicker than the market is expecting.
As always, plan for the best, but prepare for the worst. For further insights regarding the impact of inflation on equity market valuations and the defensiveness of bonds in a balanced portfolio please refer to our previous newsletters or reach out to discuss.
Wheelhouse Global Equity Income Fund
7.8%
Income over 3 years (p.a.)
8.0%
Income over 3 years (p.a.)
| 1 month | 1 year | 3 years (p.a.) | Since inception^ | |
| Income | 0.00% | 9.57% | 7.78% | 7.42% |
| Growth | 1.66% | 7.68% | 0.19% | 1.86% |
| Total Return | 1.66% | 17.25% | 7.98% | 9.29% |
| Benchmark* | 3.10% | 31.37% | 14.68% | 14.92% |
| Risk (Beta)** | n/a | 0.48 | 0.47 | 0.60 |
Performance figures are net of fees and expenses.
* Benchmark is the MSCI World Index (ex-Australia).
** Risk is defined as Beta and sourced from Morningstar Direct. Beta is represented vs the Benchmark and vs the S&P/ASX 200 Index. A Beta of 1.00 represents equivalent market risk to the comparison Index. A minimum of 12 months data is required for the calculation.
^ Inception date is 26/05/2017. Since inception figures are calculated on a p.a. basis. Past performance is not an indicator of future performance.
Click here to read the full performance report of the Wheelhouse Global Equity Income Fund.
Wheelhouse Australian Enhanced Income Fund
Performance numbers below are based on exit prices and include the 30bps exit spread.
| 1 month | 3 month | Since inception^ | |
| Income* | 0.48% | 3.93% | 4.55% |
| Growth | 2.64% | 2.82% | 9.35% |
| Total Return | 3.11% | 6.76% | 13.90% |
| Benchmark** | 2.73% | 6.22% | 13.07% |
| Excess return | 0.38% | 0.54% | 0.83% |
Performance figures are net of fees and expenses.
* Income includes cash distributions and the value of franking credits and special dividends. Cash distributions are paid quarterly.
** Benchmark is the S&P/ASX 200 Franking Credit Adjusted Daily Total Return Index (Tax-Exempt).
^ Inception date is 9/03/2021. Since inception figures are calculated on a p.a. basis. Past performance is not an indicator of future performance.
Click here to read the full performance report of the Wheelhouse Australian Enhanced Income Fund.