With interest rates at record lows, many investors are being forced into assuming greater risk in their portfolios to generate acceptable levels of income. As an example, bank term deposits are currently yielding a meagre 1.7% pa compared to the 40 year average of over 6% pa. As a consequence, investors who rely on income as a primary source of return are being forced into making more risky investment decisions to sustain their lifestyles.
Typically, retirees comprise a large portion of this ‘yield dependent’ investor class which is a cause for concern because they are often at a stage where they should be decreasing the risk in their portfolios. There are well-documented reasons to support this such as sequencing risk, shorter investment horizons and liquidity risk to name a few. Hence, achieving the optimal mix between yield and risk in a balanced retirement portfolio has possibly never been more important.
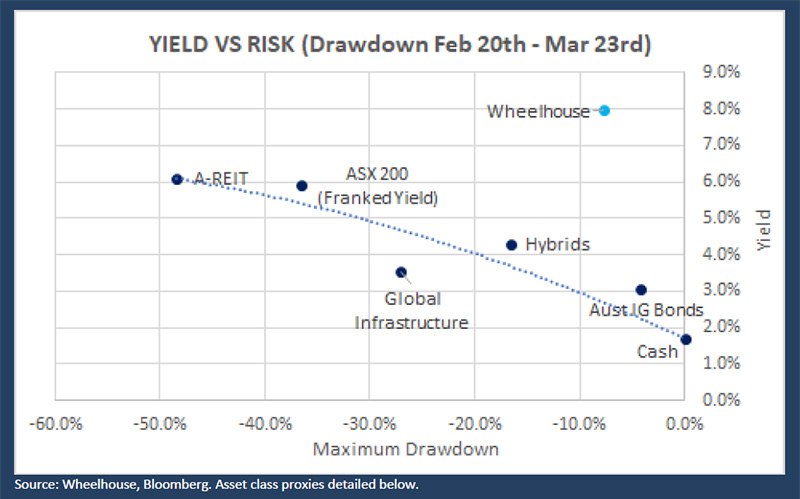
The relationship that exists between yield and risk has been applied across a selection of major asset classes in the chart below. In the first instance, we define risk as price volatility, and secondly as the drawdown experienced during the recent market rout (ie 20 February to 23 March 2020). The relationship is consistent across both metrics.
Figure 1: How much capital volatility is embedded in your income?

Figure 2: How much capital drawdown risk is embedded in your income?

In the analysis above, the blue trendline plots the relationship between increased yield, and increased risk. Investments above the line represent more efficient income portfolios for the risk assumed and conversely those below the line less efficient. The returns on cash were used as an anchor point for both risk assumptions, so to make valid comparisons with a mostly ‘risk-free’ 1.7% income return on cash.
The conclusions are readily apparent, but it is worth elaborating on the details.
- Australian Equities – In order to achieve an equivalent 6% income yield in the current environment, Australian equities (and importantly, their attached franking credit benefit), are one of the few asset classes that come close. The 5.9% gross yield assumes some level of dividend cuts during 2020, with a rebound in yields (at least from the banks) unlikely in the foreseeable future. Despite this, as their position above the blue trend line indicates, Australian equities appear to provide not only one of the highest yields, but also one of the most efficient yields when risk is considered.
- Hybrids – Given the underlying sector exposure of many convertible issues is banking, capital values held up very well relative to the 40-50% falls seen in bank share prices during the recent drawdown. Hybrids present different risks compared to other asset classes, as in certain circumstances the issuer can decide to ‘convert’ the security to more risky equity (potentially at the worst time for the holder), plus withhold coupon payments. Both of these characteristics create additional risks relative to standard fixed income securities, and are intentionally designed to add value to the issuer during times of extreme credit stress. We believe the numbers in the above analysis understate these risks and if fully considered would move the yields below the efficiency line.
- Australian Investment Grade Corporate Bonds – Average yield to maturity for Australian IG corporate bonds is currently returning 3.0%, significantly lower than average coupon rates of around 6%. The difference is explained by the decline in Australian interest rates which has pushed most bond prices well above par. Liquidity and breadth of market exposure are more difficult to achieve within the Australian corporate bond market, which in our view is a significant compromise for the slightly better than average yield versus risk relationship.
- AREITs – Subsequent to the near 50% fall during the Coronavirus rout of Feb 20 – Mar 23rd, the ASX 300 AREIT Index has only partially recovered and remains down 25% year to date. The asset class was acutely exposed to the pandemic due to its high retail sector exposure and the evaporation of foot traffic. Assisted by the capital decline, the Index is currently indicating a 6% yield although we question the delivery of this yield in the 12 months ahead. The drawdown highlights the lack of diversification within the AREIT index, with the 6% yield, even if achievable, screening unfavourably relative to the risk.
- Global Infrastructure – Along with AREITs, this sector was heavily exposed to the Coronavirus pandemic due to sudden demand destruction in global transport and electricity generation. While low interest rates globally have typically been supportive for capital values (resulting in improved drawdown characteristics versus other equity-based asset classes), current yields of 3.5% fall well below the trendline for ‘equivalent risk’ versus other asset classes.
Conclusion
Dollar for dollar, within conventional asset classes it remains difficult to go past Australian equities in terms of yield generation for the risk assumed. Even with the high exposure to financials the yield is relatively more diversified than many other typical income sources that have a high factor concentration, plus it offers ample liquidity and includes the possibility of capital growth that is not included in the above analysis. IG Bonds and Hybrids may also play a role in terms of delivering diversified sources of ‘risk efficient’ income, however breadth, liquidity, and credit deterioration (especially for hybrids) could prevent inclusion in some portfolios.
For investors willing to venture past the more ‘conventional’ asset classes there is the Wheelhouse Global Equity Income Fund. In this case ‘less conventional’ does not mean ‘more risk’ but rather the exact opposite. The Wheelhouse approach delivers a materially beneficial yield for less risk when compared to conventional alternatives, with none of the liquidity, diversification, or factor dependent risks.
Wheelhouse Global Equity Income Fund
At Wheelhouse, we recognise that income is only as good as the security of the capital that is generating it. Our unique process is outcomes-focused, and seeks to deliver a real 7-8% income stream while assuming the lowest risk possible – typically around half the equity market’s risk.
Where are we different? The funds approach to income generation and capital protection is unique, and different to all conventional strategies.
- Income – The fund is based on a diversified global portfolio of shares. Global shares are typically known for growth, but not yield. The ‘unconventional’ difference is the use of a systematic derivative overlay that coverts capital growth into a reliable 7-8% income stream.
- Protection – The second ‘unconventional’ difference is the use of an ‘always-on’ protective hedge, that preserves capital in market drawdowns. This insurance mindset will usually cost a little income during normal times, but then deliver in spades when it is most required.
With the Fund passing its three-year milestone this month, both the yield and the risk have proven consistent across a variety of market scenarios, as evidenced in the analysis above.
Yield vs risk – or as we call it, income and protection – that’s all we do.

Source: Wheelhouse
Asset class proxies
Aust IG Bonds Solactive Australian Investment Grade Corporate Bond Select Index (SOLAUSIG).
Hybrids Solactive Australian Hybrid Securities Index (SOLAUDHG). .
Global Infrastructure FTSE Global Core Infrastructure 50/50 Net Total Return Index in AUD
AREITS ASX-300 AREIT Index
Download a copy of the article here.