- May 15, 2023
Are equities forgetting 2011?
Equity investors seem to have shorter memories than fixed income investors.
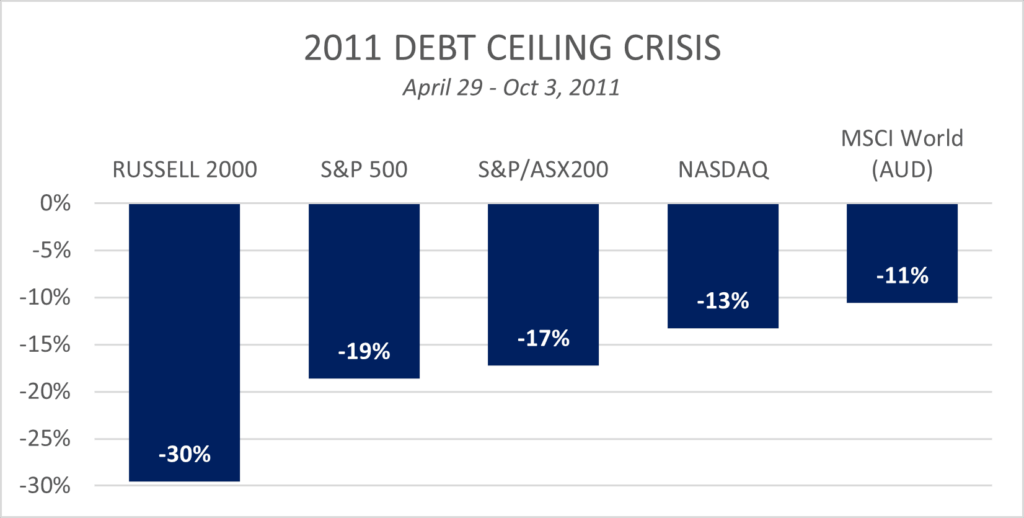
With the impending US debt ceiling garnering increasing media attention, fixed income and credit markets are moving but equities.. not so much. For context, we’ve plotted the equity market reaction the last time the market questioned the ability of the US Government to service its debt, in 2011.
The political background to the current debt ceiling crisis is well covered elsewhere, so we won’t elaborate on the elevated risk of political brinkmanship (good summary here).
It’s also worth highlighting that there have been several US Government shutdowns over the past few decades (1995-96, 2013, 2018-19) but only during the summer of 2011 did the risk of a US Government default emerge as a genuine possibility, resulting in S&P downgrading US Government credit from AAA.
Outside of partisan-charged politics, there are numerous differences between the current economic environment and 2011 which are worth considering. None more so than valuations, which were 13.1x in April 2011 versus 18.2x today. Interest rates, inflation and unemployment were all in very different places, and across the pond the European credit crisis was just evolving.
So it is fair to say that there are a number of variables which may incite the famous last words… ‘this time is different’.
One similarity to 2011 – equities see calm seas
A distinct similarity, however, is the way the equity investors are positioned (or rather, not positioned) versus bond investors.
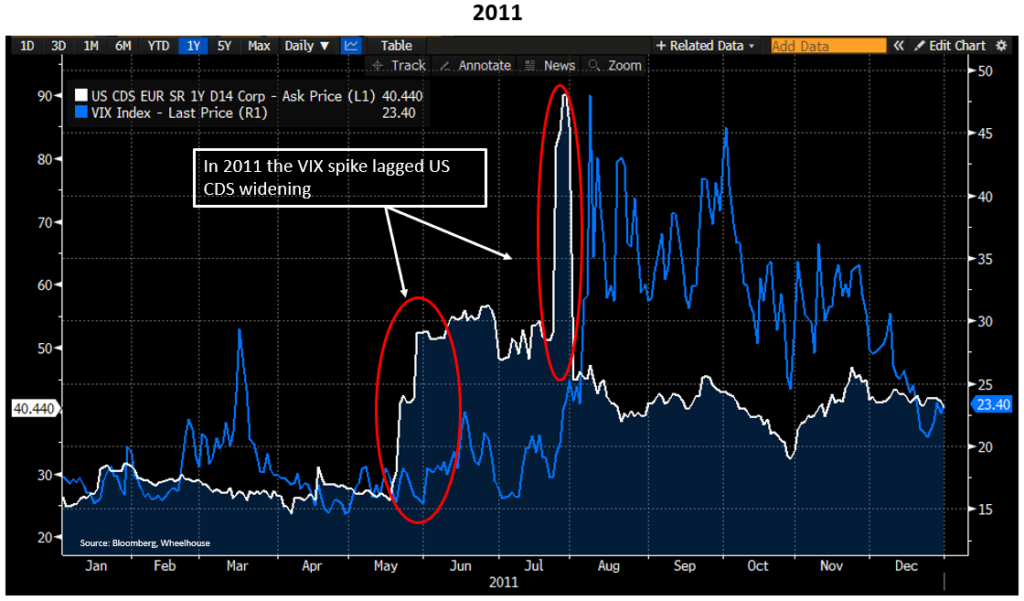
In 2011, equity volatility was calm heading into the summer, despite credit default swaps on US Government debt increasing from 25bps to 50bps, before gapping higher to 90bps. As a reminder, credit default swaps are a form of insurance that investors can purchase to protect against any losses resulting from an issuer defaulting. CDS widening means that insurance is getting more expensive due to speculation that the odds of defaulting are increasing.
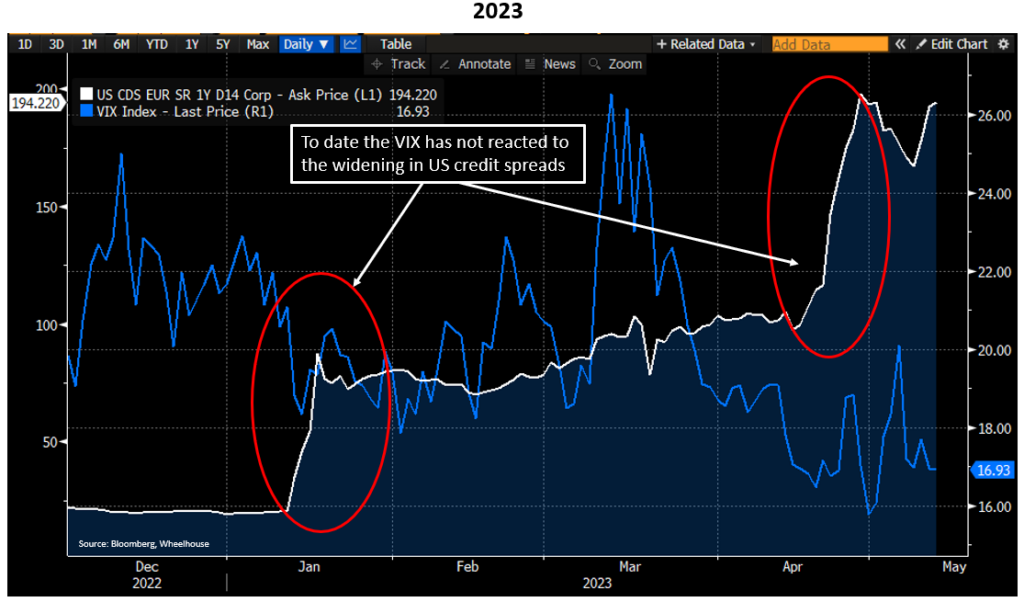
This time around in 2023, equity volatility has actually fallen to post pandemic lows in recent weeks, despite a massive spike higher in credit spreads on US Government debt.
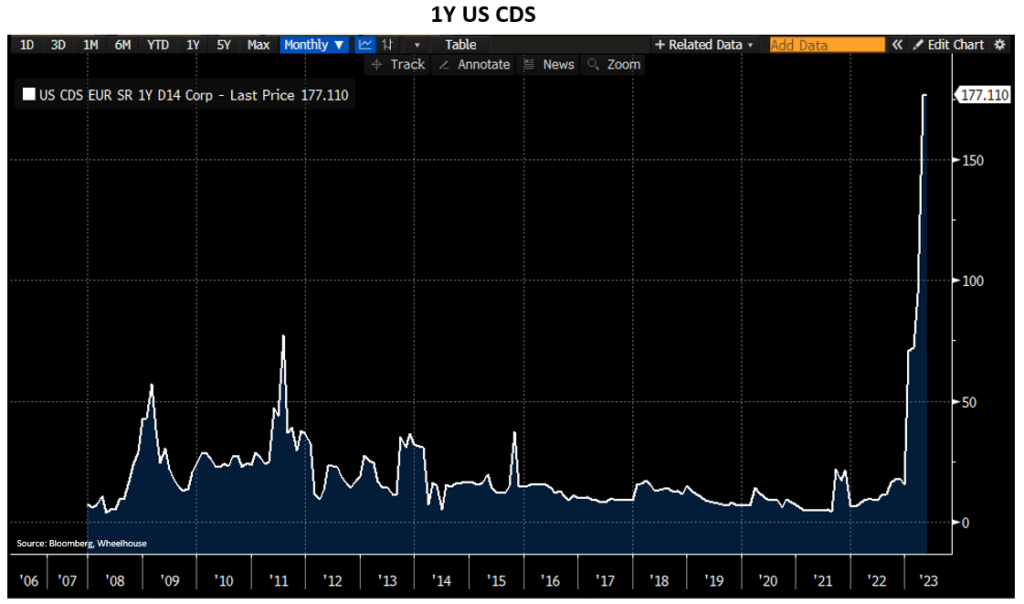
The longer-term chart of CDS pricing is even more startling. Remember, this is the annual insurance cost to protect the capital value of US Government treasuries, supposedly the safest of all investable assets globally. It’s currently costing nearly 2% a year to insure this ‘safe as houses’ asset!
Another disconnect
The US T-Bill market clearly shows another disconnect between equity and fixed income markets. T-Bills maturing around the date that the US Treasury intimated the debt ceiling would be hit now trade at distinct premium given the associated risk. Meanwhile, it is all calm on the equity front with no additional risk priced in.
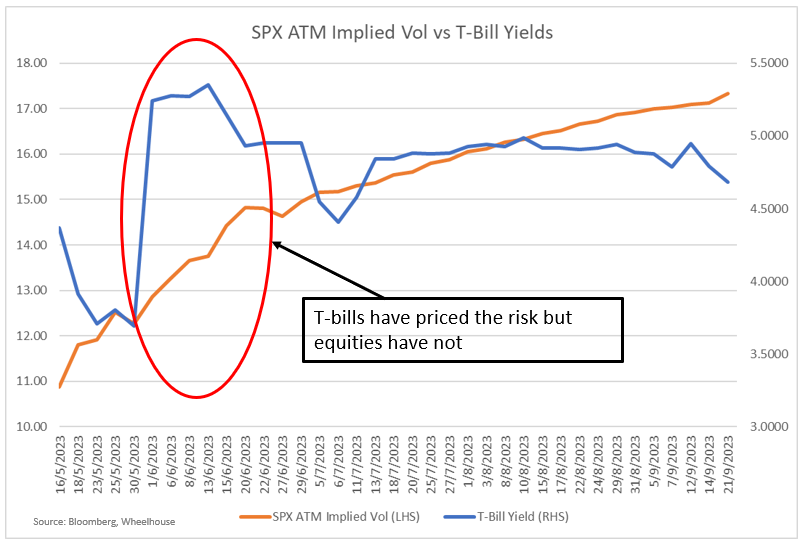
An opportunity presents
What seems apparent is that there is a divide between the pricing of risk in the fixed income vs the equity worlds. Given the potential risks and with equity volatility so low, the cost of buying protection here seems cheap.
It seems inconceivable to us that the US would actually default on their obligations and that a last minute deal would not be done. However, the potential for brinkmanship suggests that the fixed income market may be right in pricing some market turbulence in the months ahead.
We simply observe what happened last time, plus note that the ability to buy equity protection looks good value to protect against this left-hand tail risk. Even should disaster be averted, it may prove beneficial to have some insurance ready to cash in beforehand.
Whatever the outcome, Wheelhouse remains firmly committed to providing robust and reliable returns without pinning our hopes on what the markets may or may not deliver.
Wheelhouse Global Equity Income Fund
8.1%
Income over 5 years (p.a.)
7.1%
Total return 5 years (p.a.)
| 1 month | 1 year | 1 year | 3 years (p.a.) | Since inception^ | |
| Income | 0.0% | 8.4% | 8.0% | 8.1% | 7.5% |
| Growth | 1.8% | 1.8% | (2.6%) | (1.0%) | (0.5%) |
| Total Return | 1.8% | 10.2% | 5.4% | 7.1% | 7.0% |
| RBA +2.5% | 0.4% | 4.9% | 3.4% | 3.5% | 3.6% |
| Benchmark* | 3.2% | 11.1% | 12.7% | 11.1% | 11.0% |
| Market Risk** | nm | 0.4 | 0.5 | 0.5 | 0.6 |
Performance figures are net of fees and expenses.
* Benchmark is the MSCI World Index (ex-Australia).
** Risk is defined as Beta and sourced from Morningstar Direct. Beta is represented vs the Benchmark and vs the S&P/ASX 200 Index. A Beta of 1.00 represents equivalent market risk to the comparison Index. A minimum of 12 months data is required for the calculation.
^ Inception date is 26/05/2017. Since inception figures are calculated on a p.a. basis. Past performance is not an indicator of future performance.
Click here to read the full performance report of the Wheelhouse Global Equity Income Fund.
Wheelhouse Australian Enhanced Income Fund
11.5%
Income since inception p.a.
7.2%
Total return since inception p.a.
| 1 month | 3 months | 6 months | 1 year | Since inception^ | |
| Income | 0.0% | 3.1% | 4.9% | 12.2% | 11.2% |
| Growth | 1.7% | (3.2%) | 2.9% | (11.9%) | (3.4%) |
| Total Return | 1.7% | (0.1%) | 7.8% | 0.3% | 7.8% |
| Benchmark* | 1.9% | (0.3%) | 9.5% | 4.5% | 9.4% |
| Excess return | (0.2%) | 0.2% | (1.7%) | (4.2%) | (1.6%) |
Performance figures are net of fees and expenses.
* Income includes cash distributions and the value of franking credits and special dividends. Cash distributions are paid quarterly.
** Benchmark is the S&P/ASX 200 Franking Credit Adjusted Daily Total Return Index (Tax-Exempt).
^ Inception date is 9/03/2021. Since inception figures are calculated on a p.a. basis. Past performance is not an indicator of future performance.
Click here to read the full performance report of the Wheelhouse Australian Enhanced Income Fund.
For any questions or enquiries on our funds or investment strategies, please contact Wayne McGauley, Head of Distribution. Wayne can be reached on email at wayne.mcgauley@wheelhouse-
Video: Outlook - Tipping Point
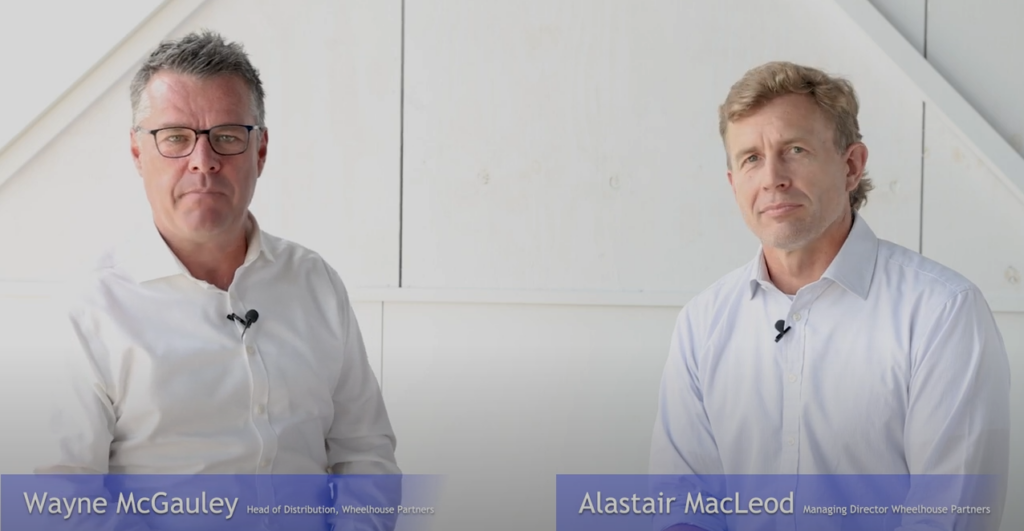
Alastair MacLeod, Portfolio Manager, explains his thoughts on why markets are at a tipping point, his views on how this tipping point is a regime change for investors and the outlook for returns and positioning of the Wheelhouse Global Fund. [8 mins]