Wheelhouse Partners investor update for December 2022

Texas hedges

(noun – A hedged position that increases rather than reduces risk. thefreedictionary.com)

For many traditional defensive strategies, 2022 was a challenging year. For bonds in particular, the drawdowns highlighted the risks of relying on historic correlations for defensive properties. Just because it worked last time, doesn’t mean it will work the next.

With seemingly all market experts predicting a continuation of recent market turbulence into 2023, we look at what hedges might work this year and highlight the defensive benefits of a genuinely diversified portfolio hedging approach.

Traditional defensive scorecard… wide dispersions

When comparing the different drawdowns of 2020 with 2022, it is worth highlighting just how unreliable and varied the different defensive exposures performed during these two periods. Staying close to home (S&P/ASX200), long Value and owning US Dollars all worked during 2022. Bonds? Not so much. Only the US Dollar proved reliably consistent, although it required a few months to kick in. 

Of note for balanced investors who prize capital security, the two environments highlighted the fact that you only needed to be wrong-footed on one defensive exposure to be left facing material negative returns. 

Why so unreliable?

Clearly the level of inflation and the subsequent change in interest rates posed a key difference between the two periods. The failure of bonds to protect a balanced portfolio should have come as no surprise, especially in an environment with high inflation – in the chart below we’ve reproduced from our May ’21 newsletter – the breakdown of the ‘typical’ negative correlation is quite apparent. 

What did come as a surprise, however, was the magnitude of the rise of inflation and the ensuing hawkishness of the Federal Reserve as well as most other Central Banks to try and crush the spiralling prices.

The contrasting returns from the different periods make it apparent that those investors relying on the more traditional defensive exposures of Value or Bonds may need to have a view (and be right!) on the direction and magnitude of interest rate changes in order to deliver reliable protection for their portfolios. 

Correlations don’t always hold

The problem with building defensive portfolios is that many defensive strategies rely on historical correlations to deliver the protective benefits. Paradigms change and as the two previous drawdowns have proven, these correlations can break down precisely when they are most needed.
 
Should the interest rate cycle change course in Q4 2023 as the market is pricing, then the favourable dynamics for many of the 2022 ‘winners’ may also reverse.   

Many investors in gold are no doubt scratching their heads that despite an inflationary surprise, the yellow metal failed to live up to its inflation-hedging reputation. In the 1970’s gold increased by 20x (yes 20 times!), meaning that even a 5% exposure to the precious metal would have helped insure an entire portfolio. This time around though, it seems that the Federal Reserve was sufficiently hawkish enough to keep market inflation expectations under control avoiding the inflation spiral seen in the 1970’s. Hence market expectations also can play a key role here as well. 

Avoiding Texas hedges (which move in the same direction as the exposure you are looking to hedge) can make huge differences in delivering reliable, repeatable defensive portfolios.

The role of alternatives

One advantage of alternative strategies is that they can provide a form of ‘mechanical’ protection, that is not reliant on historical correlations or interest rate environments.  

Like well-considered insurance, well-constructed hedges are designed with specific objectives in mind. Different strategies will exhibit different defensive characteristics and can have very different payouts. The key is getting the mix right.

We highlight two systematic risk reducing approaches below, both of which we utilise across both of our funds.

  • Option selling strategies, like a BuyWrite overlay, have delivered proven defensive benefits during more prolonged or ‘grind-down’ drawdown scenarios. Option selling generates consistent income, which is often elevated during a drawdown as volatility is higher.
  • Option buying strategies, like buying tail protection, is more akin to buying an insurance policy on the market. As with insurance there are techniques available that target specific risks and thus reduce costs.

For further analysis on these approaches during the two recent drawdowns please refer to our thought piece from June “Two very different bears”.

Well diversified hedges can take the guesswork out of delivering consistent and reliable protection. As we look forward to 2023 and the uncertainty that lies ahead, we believe a diversified hedging approach will continue to deliver value when it is most needed, without having to predict the tipping point of the interest rate cycle and the correlations that may (or may not) result.

Wheelhouse Global Equity Income Fund

8.0%

Income over 5 years (p.a.)

6.9%

Total return 5 years (p.a.)

 1 month1 year3 years p.a5 years (p.a.)Since inception^
Income1.9%7.5%7.8%8.0%7.6%
Growth(3.5%)(9.3%)(3.6%)(1.1%)(1.2%)
Total Return(1.7%)(1.8%)4.2%6.9%6.4%
RBA +2.5%0.4%3.8%3.1%3.4%3.5%
Benchmark*(5.5%)(12.5%)6.2%9.3%9.3%
Market Risk**nm0.50.40.50.6

Performance figures are net of fees and expenses.
* Benchmark is the MSCI World Index (ex-Australia).

** Risk is defined as Beta and sourced from Morningstar Direct. Beta is represented vs the Benchmark and vs the S&P/ASX 200 Index. A Beta of 1.00 represents equivalent market risk to the comparison Index. A minimum of 12 months data is required for the calculation.

^ Inception date is 26/05/2017. Since inception figures are calculated on a p.a. basis. Past performance is not an indicator of future performance.

Click here to read the full performance report of the Wheelhouse Global Equity Income Fund.

Wheelhouse Australian Enhanced Income Fund

11.3%

Income since inception p.a.

6.4%

Total return since inception p.a.

 1 month3 months6 months1 yearSince inception^
Income*1.1%1.6%5.6%12.0%11.3%
Growth(3.8%)6.8%4.9%(15.8%)(4.9%)
Total Return(2.7%)8.4%10.5%(3.8%)6.4%
Benchmark**(3.2%)9.6%10.8%0.5%7.7%
Excess return0.5%(1.2%)(0.3%)(4.3%)(1.3%)

Performance figures are net of fees and expenses.

* Income includes cash distributions and the value of franking credits and special dividends. Cash distributions are paid quarterly.

** Benchmark is the S&P/ASX 200 Franking Credit Adjusted Daily Total Return Index (Tax-Exempt).

^ Inception date is 9/03/2021. Since inception figures are calculated on a p.a. basis. Past performance is not an indicator of future performance.

Click here to read the full performance report of the Wheelhouse Australian Enhanced Income Fund.

Wheelhouse December 2022 Distributions

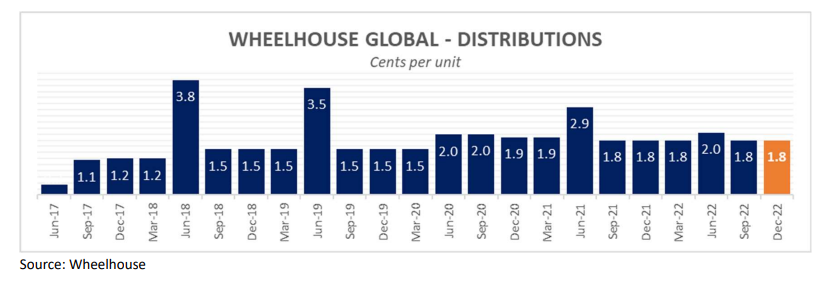
Dear fellow investor,
We are pleased to advise that the Wheelhouse funds will pay the following distributions to investors for the
quarter to 31 December 2022.

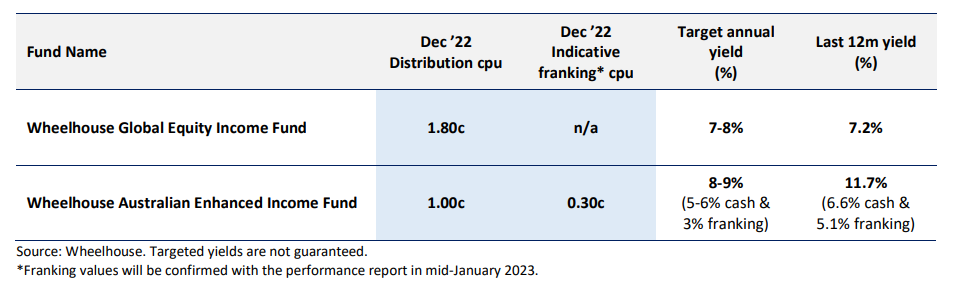
The funds’ unit prices on the 31st December will be adjusted for the cash distribution amount above. Franking is not included in the unit price so there is never any adjustment for franking.
The monthly newsletter and performance reports for both funds will be published by mid-January.

Distribution history and profile

Wheelhouse Global

The December 2022 distribution marks the 23rd consecutive quarterly distribution from the fund which has consistently met its targeted 7-8% annual income yield. Cumulatively since inception, the Fund has yielded nearly 42% over the roughly five-and-a-half-year history.

The Global Fund’s distribution is almost entirely comprised of income with minimal capital gains distributed. This income-based distribution is by design, to ensure the distribution profile is sustainable even during periods when realised capital gains may not always be available.

Wheelhouse Australian

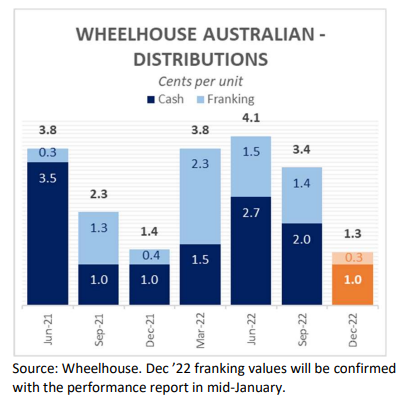
The Australian Fund has also met its distribution targets of 5-6% cash, plus around 2x the franking of the broader market (S&P/ASX200 Index). Franking generation has actually been nearer 3x the market since inception, although looking forward we believe 2x is a more realistic expectation.

A unique characteristic of the Australian Fund’s strategy is that it designed to capture around 2x the fully franked dividend yield of the market, which along with received option premium, underpins the quarterly distribution profile. With essentially zero turnover, we anticipate there will be minimal realised capital gains to distribute in a typical quarter.

Risk-targeted investing

Income has always been an important part of the total return of all our investment strategies.

Income helps us to reduce risk, reduce reliance on capital growth, and is the bedrock for our investment approach of maximising returns for a targeted level of risk. Should capital growth be more challenging in the months and years ahead, we believe the real return characteristics of income will serve us well across both strategies.

For our Global fund, this past year was another milestone in demonstrating the defensive characteristics of our investment approach across a completely different set of investment conditions. In every drawdown since inception, the fund has delivered on its defensive objectives regardless of environment or circumstance.

We’ll provide a more thorough performance update and outlook for the year ahead in our monthly newsletter, published in mid-January.

On behalf of the team at Wheelhouse, I would like to thank you for investing alongside us during 2022. Over the past 12 months we welcomed many new investors to our unique risk-targeted approach to investing and we look forward to engaging with our investors more regularly during 2023 with the recent engagement of Wayne McGauley as our Head of Distribution.

We look forward to our continued partnership and wish all our investors a safe, healthy and prosperous 2023.

Yours sincerely,
Alastair MacLeod
Managing Director