- November 17, 2022
Inflation must fall… or markets will (Part III)
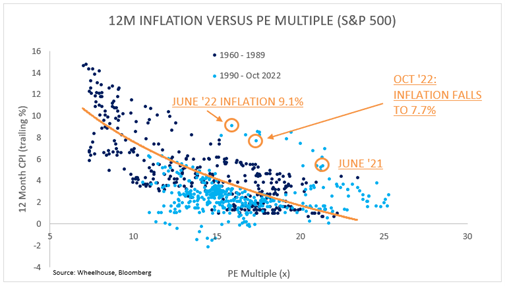
With US inflation surprising on the downside in October and perhaps signalling we’re past the worst, we have re-run our comparison of US inflation versus S&P 500 Index P/E multiples to get a sense of where we currently stand.
It seems a long time since June 2021 when we first discussed this relationship and inflation was a measly 5.4%. Since then, inflation gapped higher to a peak of 9.1% in June this year with market valuations falling closer to 15x. It is this valuation derating that has delivered most of the pain experienced by markets so far this year.
Perhaps a reality check but even with the recent softer inflation print of 7.7% this past month, market multiples remain extremely elevated relative to history for such a high inflationary period.
With peak inflation likely behind us, now comes the greater challenge of weighing how much to look through elevated high inflation and position for continued further declines. From the chart above it seems clear that with a 12m forward P/E of 17.3x, the market is already pricing a meaningful decline in inflation back to around 4% by this time next year.
While at least inflation now seems to be heading in the right direction, how long it takes to return to 4% becomes an increasingly important question. This is not to say that 4% inflation means the Fed becomes accomodative (they still have a 2% target)… but we’re just trying to map market expectations with the inflation reality in this exercise.
How quickly has inflation fallen, historically?
Excellent research from Research Affiliates addresses this question. Based on their analysis, once inflation has crested between an 8-10% range (as it appears to have in the US), historical evidence suggests that the median amount of time it takes for inflation to halve (to 4%) is 2 years.
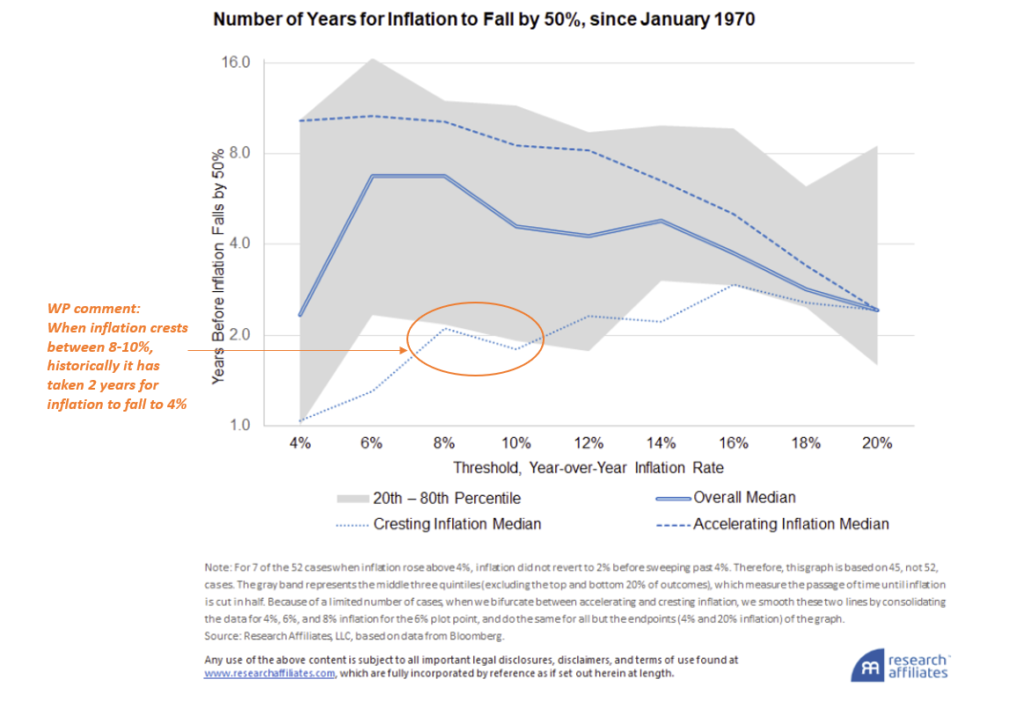
In other words, while inflation may continue to decline in coming months, we’re likely in for a relatively extended period of higher inflation and by extension higher interest rates, than perhaps a 17x P/E multiple implies.
There are of course arguments supporting a return to 4% inflation in less than 2 years. A more rapid unwind of the many exogenous factors causing the spike in the first place (shipping, supply chains, oil, geopolitics). Also, a rise in unemployment may help expedite this process, plus there has been no real evidence of a wage spiral which can be stubborn to turn around. Thus, there are reasons for optimism and 4% within a year is indeed plausible in our view.
However, the historical evidence reminds us that high inflation can be very sticky to unwind. For example the same research suggests historically it has taken 3-4 years for inflation to fall to 3%, once it has crested between 8-10%.
Whatever the timeframe, the current multiple of 17x P/E for the S&P 500 does appear to be pricing in a very rapid decline in inflation in coming months. Dare we say only a transitory episode of high inflation?
And that multiple assumes earnings hold up
As the economy digests tighter financial conditions, analysts are downgrading earnings expectations at a little over 2% a month. We’ve discussed the risks to earnings previously where the typical decline during a recession averages out at about -15%. Despite recent market downgrades, the street is still projecting earnings growth for next 2 years and this is baked into the 17.3x P/E multiple referenced above.
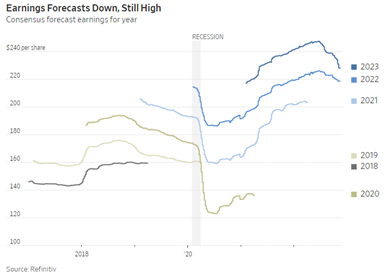
From an earnings perspective, there is still clearly another shoe to drop should we genuinely end up with a contracting economy.
To sum up
While it’s genuinely good news that inflation appears to have peaked, valuation multiples suggest the market is already looking through this and discounting an optimistic scenario of 4% inflation in 12 months time. This sanguine view is not inconsistent with 2-year US inflation breakevens of 2.5%. Despite representing a very rapid fall relative to history, there are reasons to believe this is achievable.
Meanwhile and ominously, a looming recession looks to us to be very much unpriced from an earnings perspective, making the ‘real’ P/E meaningfully higher than 17.3x should even a modicum of downgrades come to pass.
With very little margin of safety either on price or earnings, then Santa-rally or not we wouldn’t be chasing at these levels.
Time to hedge (the Australian Dollar)
We take a systematic, risk-centric approach to investing at Wheelhouse and are always looking at ways to reduce sources of risk that we have limited control over. One such risk within our Global fund is the exposure to foreign currencies, which investors receive within any unhedged Global equity portfolio.
This risk is particularly pronounced for our Global income strategy, which despite being fully invested has typically only 55% of underlying Global market risk, but 100% of the currency exposure.
For the most part, being unhedged on currency is a good thing for Australian-based investors. During a drawdown the Australian dollar will also usually decline and thus provide some protection when Global markets are falling. For example during 2022 year-to-October 31, the unhedged Global equity benchmark declined by 11% in AUD, versus 22% for the US dollar based return. Our Global fund has partly benefitted from this dynamic, only declining 2%.
However, should we enter a lower-growth sideways market in coming years, a gradually appreciating Australian dollar could weigh on our ability to deliver on our investment objectives of 7-8% income, plus a stable and growing capital base. As a result, we believe it makes sense to reduce this outsized source of risk, whilst still being mindful of the defensive characteristics that are evident during a market drawdown.
Optimal strategic hedge
From our analysis and consistent with other studies, the optimal currency hedging ratio for a diversified Global equity portfolio is around 30% hedged. This delivers the optimal risk reduction in terms of reduced volatility, but also preserves most of the defensive benefits for when the Australian dollar does fall during a crisis.
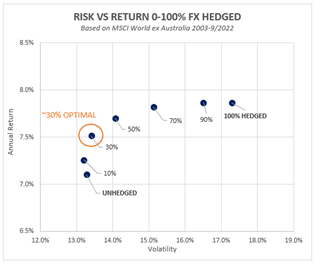
NB: Unhedged returns over this period are lower than hedged returns, as the AUD has appreciated over this period. This will not always be the case.
Going forward, we will be hedging 30% of the US dollar exposure in our Global portfolio. This will represent our strategic hedging level, with the primary objective being to reduce/remove the outsized (and uncompensated) currency risk within the portfolio, yet still retain most of the defensive benefit during a crisis.
There are a number of other advantages for currency mindful investors that the new hedging approach will deliver, including:
- No switching costs between hedged and unhedged versions of the strategy (including crossing bid/ask spreads, time out of market, or tax-event implications)
- No additional management costs – usually currency hedged funds charge higher fees. WP will absorb this.
- No impact on the distribution – this was an important consideration for investors relying on regular, reliable income. Our unique approach is not expected to have any impact on the distributable yield.
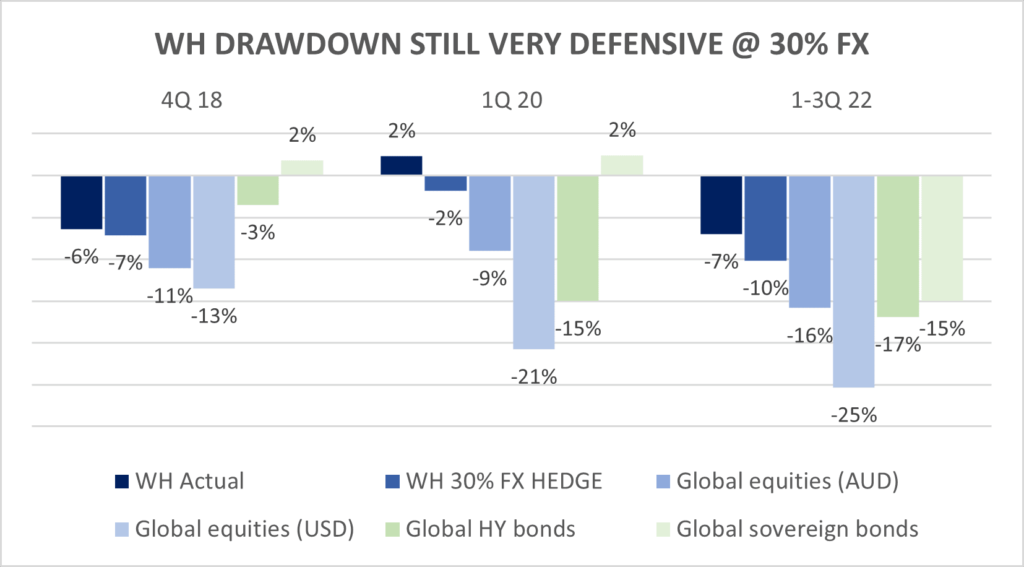
There is no change to our underlying defensive risk-targeting approach which targets downside capture of 50-60% in local currencies once the market has fallen 10% or more. However, with less currency exposure we will have less benefit from a declining Australian dollar during a crisis.
For completeness we analysed hypothetical portfolio returns on the assumption that we had a 30% currency hedge in place during recent periods of acute market drawdown, since the fund’s inception. The fund’s returns remained highly defensive across a variety of market drawdowns, something that could not always be said for other typically defensive asset classes, such as fixed income.
Tactical tilt
While over the short-term we don’t believe we have an edge in determining currency movements, we do believe that value can be added once currencies have moved into more extreme over/under valuation environments.
At extremes, we will be applying a pragmatic tactical tilt to our currency hedging exposure, based on a rules-based framework we have designed and tested internally. While not expected to be a major source of investment return, it has proven empirically to deliver additional return with minimal increase in risk.
As an example, with the currency recently close to the cheapest it has been in the past 20 years, it makes sense to increase the FX hedge ratio slightly to take advantage of the cheapening in the Australian dollar (low in October of 0.6170).
As such, the Fund FX hedge ratio was increased from a strategic 30% to a tactical 40% as the Australian dollar fell towards 0.62.
Please contact enquiries@wheelhouse-partners.
Wheelhouse Global Equity Income Fund
7.8%
Income over 5 years (p.a.)
6.7%
Total return 5 years (p.a.)
| 1 month | 1 year | 1 year | 3 years (p.a.) | Since inception^ | |
| Income | 0.0% | 7.5% | 7.6% | 7.8% | 7.5% |
| Growth | 5.2% | (7.4%) | (3.3%) | (1.1%) | (1.0%) |
| Total Return | 5.2% | 0.1% | 4.3% | 6.7% | 6.5% |
| Benchmark* | 7.8% | (4.3%) | 8.9% | 10.4% | 10.3% |
| Risk (Beta)** | nm | 0.48 | 0.42 | 0.49 | 0.60 |
Performance figures are net of fees and expenses.
* Benchmark is the MSCI World Index (ex-Australia).
** Risk is defined as Beta and sourced from Morningstar Direct. Beta is represented vs the Benchmark and vs the S&P/ASX 200 Index. A Beta of 1.00 represents equivalent market risk to the comparison Index. A minimum of 12 months data is required for the calculation.
^ Inception date is 26/05/2017. Since inception figures are calculated on a p.a. basis. Past performance is not an indicator of future performance.
Click here to read the full performance report of the Wheelhouse Global Equity Income Fund.
Wheelhouse Australian Enhanced Income Fund
11.4%
Income since inception p.a.
5.3%
Total return since inception p.a.
| 1 month | 3 months | 6 months | 1 year | Since inception^ | |
| Income* | 0.0% | 3.8% | 7.5% | 11.9% | 11.4% |
| Growth | 5.5% | 1.9% | (14.4%) | (15.2%) | (6.1%) |
| Total Return | 5.5% | 1.9% | (6.9%) | (3.4%) | 5.3% |
| Benchmark** | 6.1% | 1.4% | (4.6%) | (0.5%) | 6.4% |
| Excess return | (0.6%) | 0.5% | (2.3%) | (2.9%) | (1.1%) |
Performance figures are net of fees and expenses.
* Income includes cash distributions and the value of franking credits and special dividends. Cash distributions are paid quarterly.
** Benchmark is the S&P/ASX 200 Franking Credit Adjusted Daily Total Return Index (Tax-Exempt).
^ Inception date is 9/03/2021. Since inception figures are calculated on a p.a. basis. Past performance is not an indicator of future performance.
Click here to read the full performance report of the Wheelhouse Australian Enhanced Income Fund.
Media: Livewire Buy-Hold-Sell series
During October we participated in a series of short & punchy interviews with Dr Don Hamson from respected fellow income manager Plato. The focus of the series included:


For any questions or enquiries on our funds or investment strategies, please contact Wayne McGauley, Head of Distribution. Wayne can be reached on email at wayne.mcgauley@wheelhouse-