Want to keep your dividends but reduce risk?

Investor update for May 2022

Inflation must fall... or markets will (Part II)

With inflation punching new highs in the US on Friday and topping 8.6% annual growth, we thought it worth revisiting our chart from June last year which plots annual inflation levels in the US, versus the valuation of the S&P 500.

Since we last ran this chart nearly 12 months ago, inflation has ratcheted up to 8.6% from 5.4%, with the Russian invasion of Ukraine providing a surprise exogenous shock to global energy markets and compounding the already evident Global supply chain crisis. 

In turn, this elevated inflation (and the expected Fed response) is pulling valuations lower, with gravity difficult to fight when expected interest rates move higher. The valuation multiple has fallen from 21x to around 16x over this period, although fortunately for investors, earnings growth of over 10% has helped cushion the blow. As a result of earnings growth, the S&P500 is down only 11% over this period (despite the 22%  fall year to date).

So what does this mean? Despite the valuation de-rating to 16x, based on current levels of +8% inflation and the historic relationship with valuation multiples, in the US the multiple should be closer to 10x (!!). Therein lies the problem… inflation must fall, or markets will.

Base effect

Despite the recent inflation prints, there is a reasonable case to be made that inflation will fall in coming months, even if the main reason is simply that we will begin cycling higher prior year comparatives. Economists like to call this the ‘base effect’. 

Two-year inflation breakevens suggest a more moderate inflation expectation for the next 2-years, with 4.4% currently being priced as the difference between nominal and inflation linked bonds. 

If we refer to the historic relationship with valuation multiples, an inflation rate of 4.4% implies a PE of closer to 15x. So pretty much inline with where the market is currently trading, and much better than the 10x historic valuation should inflation remain above 8%! So perhaps at least from a valuation perspective, most is now in the price.

The other leg - Earnings

However this all assumes earnings forecasts remain unchanged, which seems increasingly unlikely. US CEO Confidence has recently taken a dive, which usually means corporate profits will follow. Furthermore, US Consumer sentiment has just posted its lowest ever recording, as higher oil prices and cost of living expenses sap disposable incomes. 

Downgrades to corporate earnings appear not be fully reflected in market estimates yet, although following US reporting season next month we believe they likely will start to be. Earnings downgrades will push PE multiples higher, again causing problems for current equity valuations.

Can we just hide out in commodities?

Commodities and energy exposure in particular have been the standout winners this year to date, and particularly since February 24th when Russia crossed the border into Ukraine. Whether it be agricultural commodities or mineral resources, most have rallied meaningfully the past 100 days. 

One outlier that’s worth flagging is copper, or ‘Doctor Copper’ to economists due to the metals ability to predict turning points in the global economy (economists say it has a PhD in economics). The relationship stems from coppers widespread use in all areas of the global industrial economy, with few other non-industrial applications. As a result, copper has proven a reliable leading indicator of economic activity in the broader economy.

The flipside of rocketing commodity prices is the eventual drag this has on economic growth, with the decline in copper over this period casting a shadow over the continued strength of all commodities. This is despite the higher copper intensity of electric cars and many other applications that may be considered to do well during an energy price spike. 

While the recent slowdown in China also has an impact on copper demand (China accounts for over half of the metals output), it seems hard to ignore the breakdown with other commodities and the potential signal this is flashing that concern may have tilted from coppers value as an inflation hedge, to coppers potential downside should economic conditions deteriorate. 

As the saying goes the best solution for higher oil prices is… higher oil prices, as energy users either curtail demand, or seek alternative power supplies. So while the flight for inflation havens seems robust for now, we’d caution that as every month the economy cools, a softening demand environment may catch up with supply side issues more rapidly than expected. Year to date, energy stocks in the US have had a fantastic run.

Outlook

From an investment perspective, the focus on inflation versus interest rates versus economic activity is dominating short-term share market returns as macro themes overpower stock specifics. As a result, correlations between individual securities have increased year-to-date, which means more shares are moving in the same direction on a given day (energy and resources have been the exceptions!). Higher correlations mean the market swings more like a pendulum, thus with higher volatility. 

This higher volatility can create opportunities for our strategies at Wheelhouse. Investors in our funds will know that we focus on systematic option selling strategies that both produce income and reduce risk. During these periods of heightened uncertainty, the income generation increases, as does the real return generation versus owning a portfolio comprised entirely of equities.

In the more recent past, one of the negatives of overlay strategies is that they are likely to relatively underperform in strong market recoveries. For the past ten years, spikes in volatility (and market corrections) were usually accompanied by a subsequent snap back in equity markets as the ‘Fed put’ sparked buy-the-dip investor responses. In this ‘snap-back’ environment, relative returns for overlays have suffered as the higher income generation has been outweighed by the aggressive market recovery.

However in today’s environment, minus the Fed put and with economic growth slowing, it seems likely to us that a lower growth, more volatile investment world awaits. In this environment, income generation is likely to remain elevated, but with far fewer of the ‘snap-back’ buy-the-dip type recoveries. With more of the positives (higher income) and fewer of the negatives (drag in strong markets), overlay strategies should be well placed to differentiate and add value in a generally lower-growth environment where returns from capital growth are likely far more challenged

Wheelhouse Global Equity Income Fund

7.9%

Income over 3 years (p.a.)

5.3%

Total over 3 years (p.a.)

 1 month1 year3 years (p.a.)Since inception^
Income0.00%7.76%7.90%7.23%
Growth(0.09%)(7.90%)(2.65%)(1.01%)
Total Return(0.09%)(0.14%)5.25%6.22%
Benchmark*(0.83%)2.64%11.44%10.56%
Risk (Beta)**n/a0.530.440.59

Performance figures are net of fees and expenses.
* Benchmark is the MSCI World Index (ex-Australia).

** Risk is defined as Beta and sourced from Morningstar Direct. Beta is represented vs the Benchmark and vs the S&P/ASX 200 Index. A Beta of 1.00 represents equivalent market risk to the comparison Index. A minimum of 12 months data is required for the calculation.

^ Inception date is 26/05/2017. Since inception figures are calculated on a p.a. basis. Past performance is not an indicator of future performance.

Click here to read the full performance report of the Wheelhouse Global Equity Income Fund.

Wheelhouse Australian Enhanced Income Fund

10.4%

 Income since inception (p.a.)

11.6%

Total return since inception (p.a.)


 1 month3 months12 monthsSince inception^
Income*1.46%3.36%11.83%10.41%
Growth(3.67%)0.18%(4.60%)1.19%
Total Return(2.21%)3.54%7.23%11.60%
Benchmark**(2.45%)3.54%6.34%10.64%
Excess return0.24%0.00%0.89%0.96%

Performance figures are net of fees and expenses.

* Income includes cash distributions and the value of franking credits and special dividends. Cash distributions are paid quarterly.

** Benchmark is the S&P/ASX 200 Franking Credit Adjusted Daily Total Return Index (Tax-Exempt).

^ Inception date is 9/03/2021. Since inception figures are calculated on a p.a. basis. Past performance is not an indicator of future performance.

Click here to read the full performance report of the Wheelhouse Australian Enhanced Income Fund.

News

Want to keep your fully-franked dividends but reduce risk?

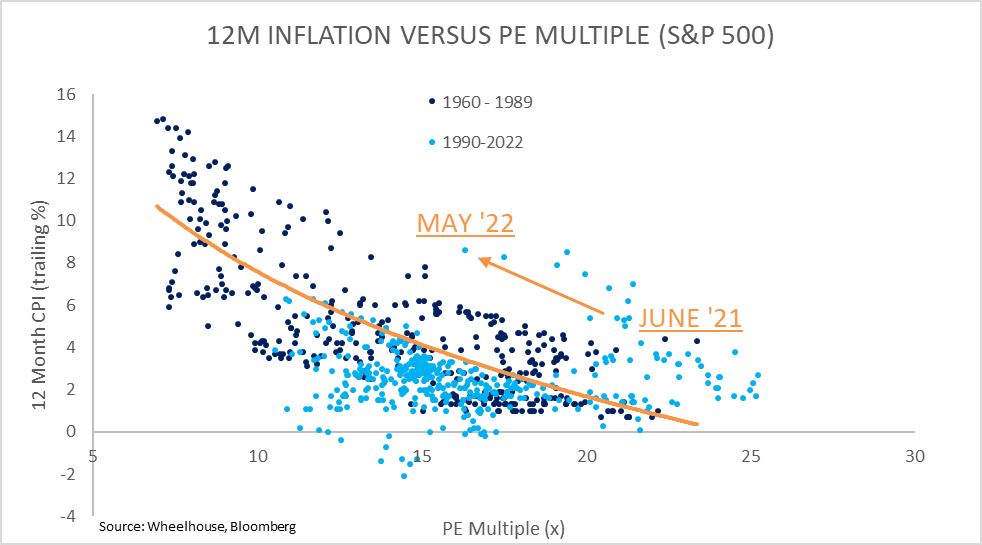
As market returns trend lower, many investors are waking up to the underlying risk in their portfolios. In recent years as interest rates have marched steadily towards zero, investors who rely on income have been forced further out along the risk curve in order to generate sufficient yield.

Is there another way to capture full dividend yields, including franking, but with less risk? 
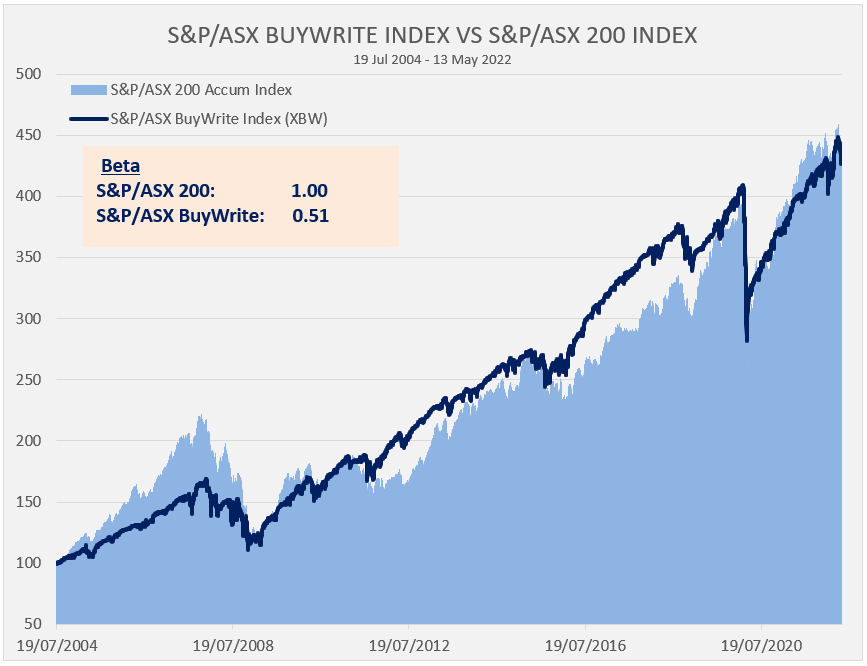
In this wire, we’ll introduce a systematic approach that for the past 18 years has captured the full dividend yield of the Australian market, and full equity returns, but has achieved this with around half the Beta (or risk) of the market. Later in the article we’ll also introduce our Australian fund that uses this source of superior risk-adjusted returns to target alpha, or outperformance.

View Article here