Income Efficiency – increasing yield whist minimising risk

  • Meagre yields from cash/bonds have left many investors reducing their usual weights to these defensive assets insearch of more acceptable returns.
  • Investors have been pushed further along the risk curve and forced to shoulder meaningfully higher capital risk.
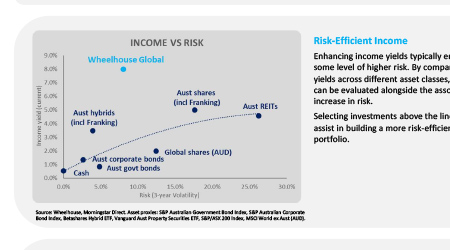
  • Wheelhouse Global targets enhanced income efficiency – increasing income whilst minimising additional risk.

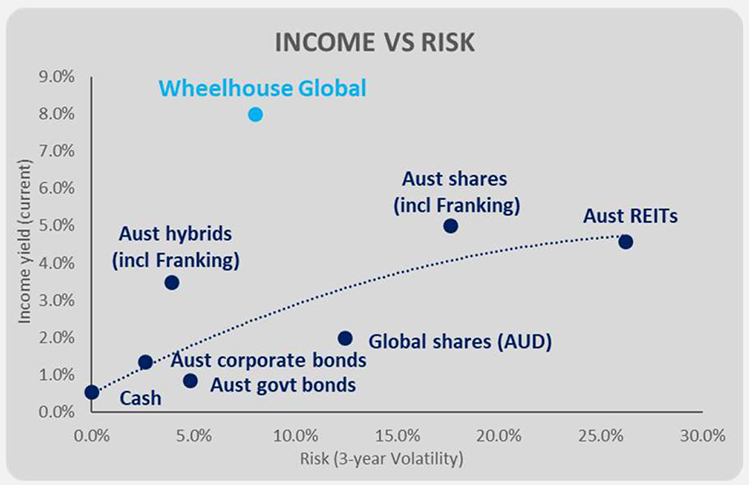
Source: Wheelhouse, Morningstar Direct. Asset proxies: S&P Australian Government Bond Index, S&P Australian Corporate Bond Index, Betashares Hybrid ETF, Vanguard Aust Property Securities ETF, S&P/ASX 200 Index, MSCI World ex Aust (AUD).

Risk-Efficent Income

Enhancing income yields typically entails some level of higher risk. By comparing yields across different asset classes, income can be evaluated alongside the associated increase in risk.

Selecting investments above the line should assist in building a more risk-efficient income portfolio.

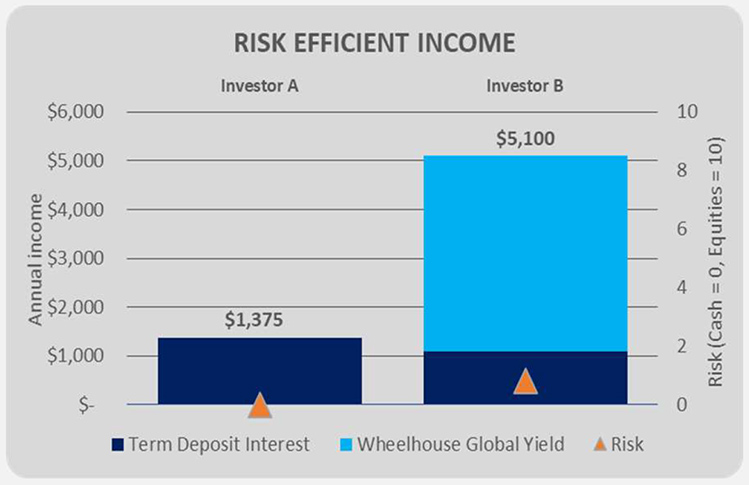
Source: Wheelhouse. Investor B assumes 20% allocation to Wheelhouse Global

Scenario Analysis

  • Investor A: $250,000 invested in term deposit yielding 0.55% pa, and;
  • Investor B: $200,000 invested in term deposit yielding 0.55% pa, plus $50,000 invested in Wheelhouse Global yielding 8.0% pa.

By introducing a 20% allocation to Wheelhouse Global from the investor’s cash allocation, the income yield increases 3.7x from $1,375 to $5,100 pa.

Of equal importance, the portfolio risk only increases from zero to 0.9, or less than one-tenth the risk of being fully invested in Australian equities.

The Wheelhouse Global Fund’s strategy was specifically designed with income efficiency in mind.

The Fund objective is to deliver a 7-8% income yield, while assuming half the risk of equity markets. As a result the Fund is the lowest risk equity fund in the Morningstar long-only universe, but also one of the highest yielding.

For more information on Wheelhouse and their income funds please refer www.wheelhouse-partners.com

Pfizer’s jab costs $35… versus $3 for AstraZeneca’s. Sound fair?

When receiving my jab last month (thankyou nurses at RBWH in Brisbane for your excellent care!) I couldn’t help wondering how much all these vaccines were costing.

From a purely supply and demand perspective, the drug companies should be able to name their price. How much would our government have paid for an extra 1m Pfizer doses delivered two months ago? How much did we pay Poland on the secondary market for 1m does last week?

So how much are they?

As it turns out, the answer depends upon what brand you receive.

Reported global prices for Pfizer are around AUD$35 per jab and AstraZeneca are around AUD$3. The price difference is staggering when put in context of the billions of doses required to vaccinate most of the global population.

Why so different?

The price difference is due to the vastly different profit motives for this particular vaccine. AstraZeneca is pricing their Covid vaccine on a not-for-profit basis, at least until the pandemic is under control. Johnson & Johnson have done the same with their Covid vaccine.

However Pfizer, Moderna and Novavax have made no such election and are generating profits… very large profits.

In the recent Pfizer 2Q earnings release, Pfizer upgraded 2021 revenue expectations for their Covid vaccine to US$27bn, which at that level will account for nearly one-third of the companies entire annual revenue. For AZN, the profit impact is expected to be zero.

The profitability of Pfizer’s Covid vaccine is impacting the share price. Year to date the shares are up nearly 40%, versus AZN only up 20% (in USD).


We own both Pfizer and AstraZeneca in our Global fund, and we contacted the Morningstar Healthcare Analyst in Chicago about what we felt was a potential ESG concern on pricing.

Read full article here

Investor Update for July 2021

Season’s greetings!

As with every August, dividend season is again on our doorsteps. Over the next two months, 116 companies in the ASX 200 Index are expected to deliver the largest quarterly dividend payout in history. Relative to the market this equates to a 1.3% dividend yield for the two-month period from today, with franking on top of this.


There is a high degree of concentration in the quarter’s payout. Nearly two-thirds of the quarterly dividend payout is being driven by five companies, comprised of Rio Tinto, BHP, Fortescue, Commonwealth Bank and Wesfarmers. The composition of these dividend heavyweights, with three miners included, belies the real driver of the bumper dividend season.. iron ore. 

Are the mining dividends sustainable?

Fortescue is perhaps the most pertinent case in point. As the iron ore price has surged over US$200/t, so too have the dividends.

For these levels to be sustainable, we would argue that so too the iron ore price needs to be sustainable. Based on most analysis we have read this seems difficult to justify. Observing the price of iron ore in the past two weeks, which as fallen over 20% from it’s highs, it’s clear to see the reason why the miners are classified as ‘cyclicals’.

The sleeping giant - banks

While the dividends from the miners may be near peak, the outlook for the banks looks decidedly different. With APRA removing the payout handcuffs late last year and balance sheets now appearing well capitalised, it seems Suncorp and CBA have already taken the lead in upping dividend and tax effective capital return initiatives to investors. Perhaps more of a slowburn than the massive ramp up in the miners payouts, but meaningful nonetheless given that the 4 banks still account for over 20% of the broader index.

Wheelhouse Australian - an alternative for boosting dividends

As we head into dividend season we felt it worth flagging our expectations for our Australian fund over this period. The strategy benefits from dividends on $2 worth of equities (and equiv franking) for every $1 invested. While the primary objective of the strategy is outperformance vs the ASX200, and assumes market risk to do this (in contrast to our Global fund), the income return during high dividend periods is also expected to be meaningfully higher than the market. Please email us for any questions on the Australian fund.

Wheelhouse Global Equity Income Fund

7.9%

Income over 3 years (p.a.)

9.0%

Total Return over 3 years (p.a.)

 1 month1 year3 years (p.a.)Since inception^
Income0.00%9.39%7.86%7.55%
Growth3.37%5.69%1.15%1.50%
Total Return3.37%15.08%9.01%9.05%
Benchmark*4.03%31.85%15.07%14.41%
Risk (Beta)**n/a0.450.490.59

Performance figures are net of fees and expenses.
* Benchmark is the MSCI World Index (ex-Australia).

** Risk is defined as Beta and sourced from Morningstar Direct. Beta is represented vs the Benchmark and vs the S&P/ASX 200 Index. A Beta of 1.00 represents equivalent market risk to the comparison Index. A minimum of 12 months data is required for the calculation.

^ Inception date is 26/05/2017. Since inception figures are calculated on a p.a. basis. Past performance is not an indicator of future performance.

Click here to read the full performance report of the Wheelhouse Global Equity Income Fund.

Wheelhouse Australian Enhanced Income Fund

Performance numbers below are based on exit prices and include the 30bps exit spread.

 1 month3 monthsSince inception^
Income*0.00%3.74%3.92%
Growth1.34%2.52%6.54%
Total Return1.35%6.26%10.46%
Benchmark**1.10%5.97%10.07%
Excess return0.25%0.29%0.39%

Performance figures are net of fees and expenses.

* Income includes cash distributions and the value of franking credits and special dividends. Cash distributions are paid quarterly.

** Benchmark is the S&P/ASX 200 Franking Credit Adjusted Daily Total Return Index (Tax-Exempt).

^ Inception date is 9/03/2021. Since inception figures are calculated on a p.a. basis. Past performance is not an indicator of future performance.

Click here to read the full performance report of the Wheelhouse Australian Enhanced Income Fund.